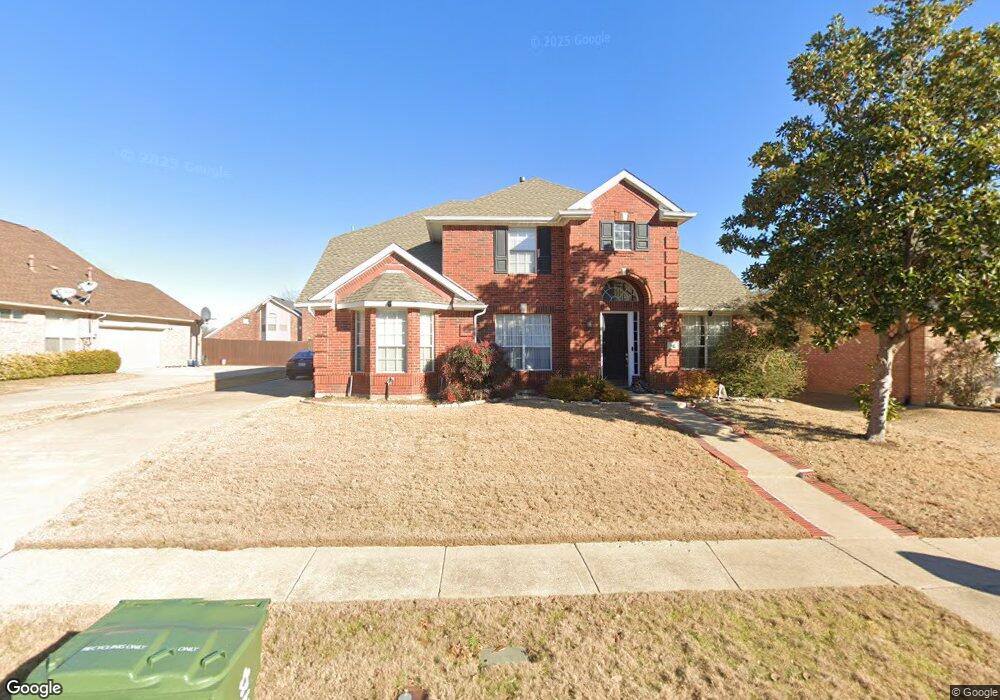
119 Sweetgum Dr Murphy, TX 75094
Estimated Value: $484,540 - $560,000
4
Beds
3
Baths
2,711
Sq Ft
$189/Sq Ft
Est. Value
About This Home
This home is located at 119 Sweetgum Dr, Murphy, TX 75094 and is currently estimated at $511,385, approximately $188 per square foot. 119 Sweetgum Dr is a home located in Collin County with nearby schools including Miller Elementary School, Murphy Middle School, and C A Mcmillen High School.
Ownership History
Date
Name
Owned For
Owner Type
Purchase Details
Closed on
Oct 11, 2021
Sold by
Dang Chuong
Bought by
Banh Julia Hoang Phuong and Banh Phuong
Current Estimated Value
Purchase Details
Closed on
Feb 24, 2003
Sold by
Veal Landry L and Veal Tangela Tuanith
Bought by
Dang Chuong
Home Financials for this Owner
Home Financials are based on the most recent Mortgage that was taken out on this home.
Original Mortgage
$144,800
Interest Rate
5.93%
Purchase Details
Closed on
May 29, 1998
Sold by
U S Home Corp
Bought by
Veal Landry L and Veal Tangela Tuanith
Home Financials for this Owner
Home Financials are based on the most recent Mortgage that was taken out on this home.
Original Mortgage
$160,959
Interest Rate
7.2%
Mortgage Type
VA
Create a Home Valuation Report for This Property
The Home Valuation Report is an in-depth analysis detailing your home's value as well as a comparison with similar homes in the area
Home Values in the Area
Average Home Value in this Area
Purchase History
| Date | Buyer | Sale Price | Title Company |
|---|---|---|---|
| Banh Julia Hoang Phuong | -- | None Available | |
| Dang Chuong | -- | -- | |
| Veal Landry L | -- | -- |
Source: Public Records
Mortgage History
| Date | Status | Borrower | Loan Amount |
|---|---|---|---|
| Previous Owner | Dang Chuong | $144,800 | |
| Previous Owner | Veal Landry L | $160,959 |
Source: Public Records
Tax History Compared to Growth
Tax History
| Year | Tax Paid | Tax Assessment Tax Assessment Total Assessment is a certain percentage of the fair market value that is determined by local assessors to be the total taxable value of land and additions on the property. | Land | Improvement |
|---|---|---|---|---|
| 2025 | $6,469 | $482,977 | $115,000 | $367,977 |
| 2024 | $6,469 | $489,779 | $115,000 | $351,000 |
| 2023 | $6,469 | $445,887 | $115,000 | $330,887 |
| 2022 | $7,670 | $391,666 | $100,000 | $291,666 |
| 2021 | $6,364 | $308,194 | $80,000 | $228,194 |
| 2020 | $6,394 | $306,164 | $70,000 | $236,164 |
| 2019 | $6,706 | $306,074 | $70,000 | $236,074 |
| 2018 | $6,630 | $299,861 | $70,000 | $234,328 |
| 2017 | $6,027 | $272,601 | $70,000 | $202,601 |
| 2016 | $5,991 | $267,603 | $60,000 | $207,603 |
| 2015 | $4,750 | $233,477 | $45,000 | $188,477 |
Source: Public Records
Map
Nearby Homes
- 202 Sweetgum Dr
- 237 Mimosa Dr
- 248 Mimosa Dr
- 524 Jasmine Dr
- 5421 Palace Dr
- Grand Whitehall Plan at Lakes at Legacy
- Grand Heritage Plan at Lakes at Legacy
- Alexandria II Plan at Lakes at Legacy
- Grand Tour Plan at Lakes at Legacy
- Tiffany II Plan at Lakes at Legacy
- Downton Abbey Plan at Lakes at Legacy
- Grand Emerald III Plan at Lakes at Legacy
- Grand Alexandria Plan at Lakes at Legacy
- Grand South Pointe Plan at Lakes at Legacy
- Lake Forest Plan at Lakes at Legacy
- Grand Lantana Plan at Lakes at Legacy
- Hartford Plan at Lakes at Legacy
- Rivercrest Plan at Lakes at Legacy
- 5413 Carrington Dr
- 113 Birch Blvd
- 123 Sweetgum Dr
- 115 Sweetgum Dr
- 117 Fallbrook Dr
- 113 Fallbrook Dr
- 121 Fallbrook Dr
- 111 Sweetgum Dr
- 127 Sweetgum Dr
- 118 Sweetgum Dr
- 122 Sweetgum Dr
- 116 Sweetgum Dr
- 109 Fallbrook Dr
- 125 Fallbrook Dr
- 126 Sweetgum Dr
- 131 Sweetgum Dr
- 112 Sweetgum Dr
- 129 Fallbrook Dr
- 130 Sweetgum Dr
- 119 Glenwood Dr
- 123 Glenwood Dr
- 135 Sweetgum Dr