Estimated Value: $296,000 - $442,000
--
Bed
--
Bath
1,345
Sq Ft
$259/Sq Ft
Est. Value
About This Home
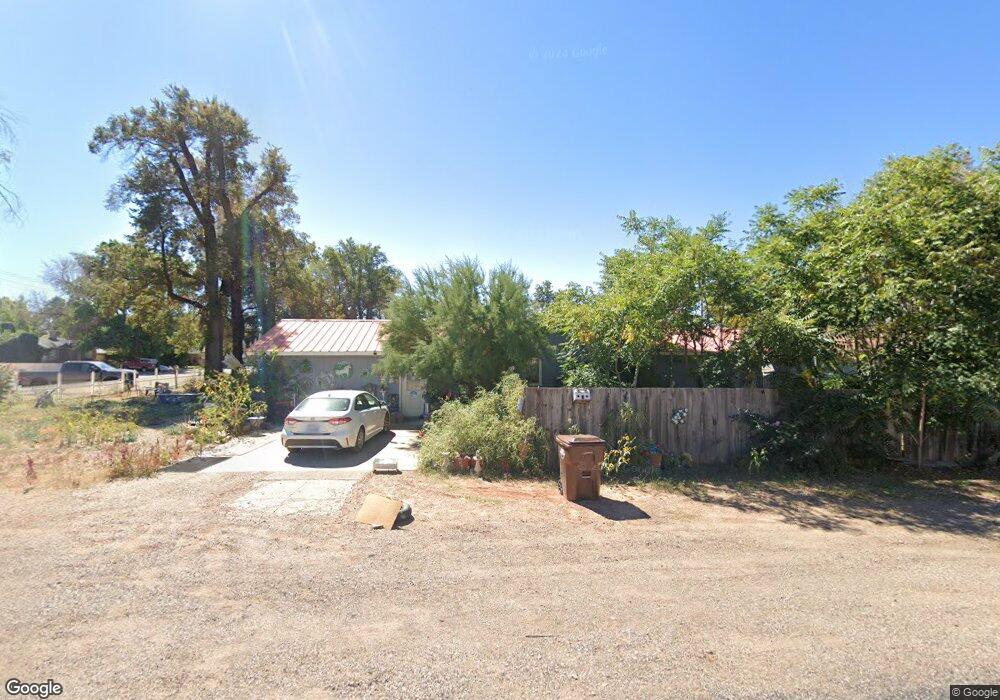
This home is located at 119 W 300 N, Kanab, UT 84741 and is currently estimated at $348,203, approximately $258 per square foot. 119 W 300 N is a home located in Kane County with nearby schools including Kanab Elementary School, Kanab Middle School, and Kanab High School.
Ownership History
Date
Name
Owned For
Owner Type
Purchase Details
Closed on
Mar 3, 2025
Bought by
Mcginnis Douglas Paul and Dapore Wendy S
Current Estimated Value
Purchase Details
Closed on
Mar 18, 2013
Sold by
Eden Donna Lee
Bought by
Willner Mary
Purchase Details
Closed on
Apr 15, 2011
Sold by
Higginson John
Bought by
Eden Donna Lee
Home Financials for this Owner
Home Financials are based on the most recent Mortgage that was taken out on this home.
Original Mortgage
$67,200
Interest Rate
4.83%
Purchase Details
Closed on
Jul 5, 2006
Sold by
Loewer Roland
Bought by
Higginson John
Purchase Details
Closed on
Feb 3, 2006
Sold by
Ccd Lc
Bought by
Loewer Roland
Create a Home Valuation Report for This Property
The Home Valuation Report is an in-depth analysis detailing your home's value as well as a comparison with similar homes in the area
Home Values in the Area
Average Home Value in this Area
Purchase History
| Date | Buyer | Sale Price | Title Company |
|---|---|---|---|
| Mcginnis Douglas Paul | -- | -- | |
| Willner Mary | -- | -- | |
| Eden Donna Lee | -- | -- | |
| Higginson John | -- | -- | |
| Loewer Roland | -- | -- |
Source: Public Records
Mortgage History
| Date | Status | Borrower | Loan Amount |
|---|---|---|---|
| Previous Owner | Eden Donna Lee | $67,200 |
Source: Public Records
Tax History Compared to Growth
Tax History
| Year | Tax Paid | Tax Assessment Tax Assessment Total Assessment is a certain percentage of the fair market value that is determined by local assessors to be the total taxable value of land and additions on the property. | Land | Improvement |
|---|---|---|---|---|
| 2025 | $3,045 | $339,537 | $100,830 | $238,707 |
| 2024 | $3,045 | $194,649 | $44,661 | $149,988 |
| 2023 | $2,731 | $178,887 | $42,534 | $136,353 |
| 2022 | $2,416 | $156,675 | $32,718 | $123,957 |
| 2021 | $2,186 | $212,705 | $45,760 | $166,945 |
| 2020 | $2,113 | $199,599 | $41,600 | $157,999 |
| 2019 | $983 | $164,533 | $43,428 | $121,105 |
| 2018 | $948 | $157,295 | $36,190 | $121,105 |
| 2017 | $900 | $142,532 | $32,900 | $109,632 |
| 2016 | $1,470 | $124,340 | $32,900 | $91,440 |
| 2015 | $1,130 | $116,360 | $32,900 | $83,460 |
| 2014 | $1,130 | $95,071 | $35,444 | $59,627 |
| 2013 | -- | $52,289 | $0 | $0 |
Source: Public Records
Map
Nearby Homes