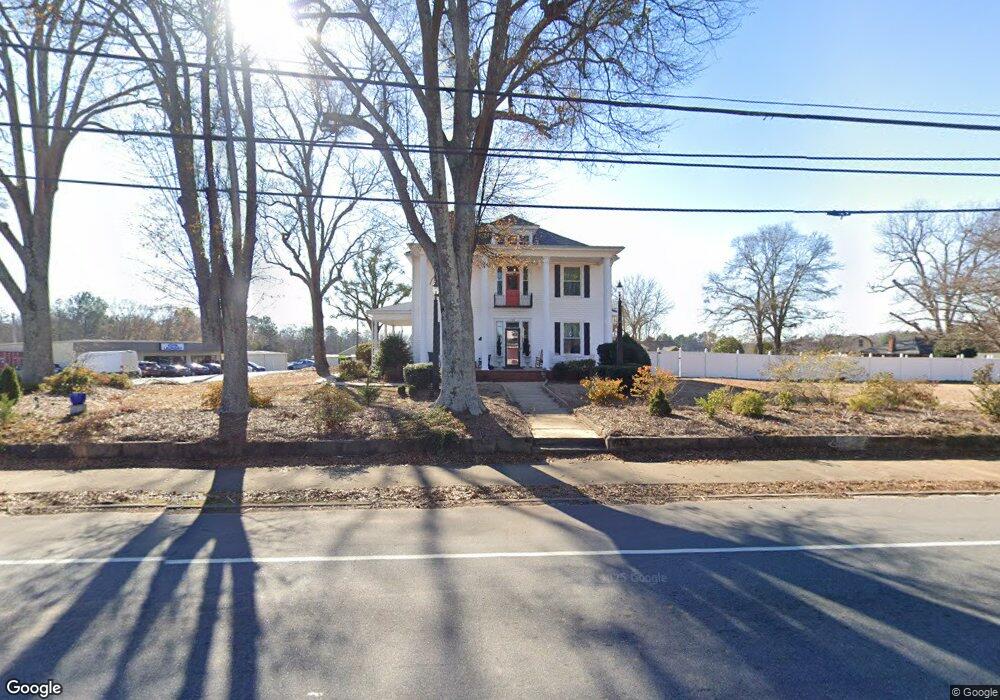
119 W Main St Duncan, SC 29334
Estimated Value: $360,000 - $513,289
5
Beds
6
Baths
3,733
Sq Ft
$115/Sq Ft
Est. Value
About This Home
This home is located at 119 W Main St, Duncan, SC 29334 and is currently estimated at $430,322, approximately $115 per square foot. 119 W Main St is a home located in Spartanburg County with nearby schools including Duncan Elementary School, Byrnes Freshman Academy, and Beech Springs Middle School.
Ownership History
Date
Name
Owned For
Owner Type
Purchase Details
Closed on
Aug 11, 2020
Sold by
Gergley Properties Llc
Bought by
Geen Roseanne E and Porter James David
Current Estimated Value
Purchase Details
Closed on
Sep 18, 2015
Sold by
Baker Jack L
Bought by
Gergley Properties Llc
Home Financials for this Owner
Home Financials are based on the most recent Mortgage that was taken out on this home.
Original Mortgage
$185,000
Interest Rate
3.97%
Mortgage Type
New Conventional
Purchase Details
Closed on
Nov 20, 2014
Sold by
Lissett Mary Francis
Bought by
Federal National Mortgage Association and Fannie Mae
Purchase Details
Closed on
Jul 15, 2004
Sold by
Jasmine Place Llc
Bought by
Liggett Mary Frances
Purchase Details
Closed on
Jul 9, 2003
Sold by
Rogers D Steve and Rogers Ellen G
Bought by
Jasmine Place Llc
Create a Home Valuation Report for This Property
The Home Valuation Report is an in-depth analysis detailing your home's value as well as a comparison with similar homes in the area
Home Values in the Area
Average Home Value in this Area
Purchase History
| Date | Buyer | Sale Price | Title Company |
|---|---|---|---|
| Geen Roseanne E | $77,169 | None Available | |
| Gergley Properties Llc | $185,000 | None Available | |
| Federal National Mortgage Association | $225,000 | -- | |
| Liggett Mary Frances | -- | -- | |
| Jasmine Place Llc | $260,000 | -- |
Source: Public Records
Mortgage History
| Date | Status | Borrower | Loan Amount |
|---|---|---|---|
| Previous Owner | Gergley Properties Llc | $185,000 |
Source: Public Records
Tax History Compared to Growth
Tax History
| Year | Tax Paid | Tax Assessment Tax Assessment Total Assessment is a certain percentage of the fair market value that is determined by local assessors to be the total taxable value of land and additions on the property. | Land | Improvement |
|---|---|---|---|---|
| 2025 | $2,167 | $9,852 | $518 | $9,334 |
| 2024 | $2,167 | $9,852 | $518 | $9,334 |
| 2023 | $2,167 | $9,852 | $518 | $9,334 |
| 2022 | $1,856 | $8,132 | $600 | $7,532 |
| 2021 | $1,812 | $8,132 | $600 | $7,532 |
| 2020 | $1,812 | $8,132 | $600 | $7,532 |
| 2019 | $1,796 | $8,132 | $600 | $7,532 |
| 2018 | $1,702 | $8,132 | $600 | $7,532 |
| 2017 | $1,587 | $7,396 | $600 | $6,796 |
| 2016 | $1,533 | $7,396 | $600 | $6,796 |
| 2015 | $5,607 | $13,537 | $787 | $12,750 |
| 2014 | $1,424 | $9,025 | $525 | $8,500 |
Source: Public Records
Map
Nearby Homes
- 114 N Moore St
- 11 Campbell St
- 148 N Church St
- 160 Duncanwood Dr
- 113 N Spencer St
- 108 Lynwood Dr
- 138 S Church St
- 102 Duncan Heights Rd
- 224 Hotchkiss Ln
- 226 Christopher Street Extension
- 91 Lawrence St
- 560 Ward Wilson Trail
- 563 Ward Wilson Trail
- 580 Ward Wilson Trail
- 544 Ward Wilson Trail
- 567 Ward Wilson Trail
- 552 Ward Wilson Trail
- 595 Ward Wilson Trail
- 600 Ward Wilson Trail
- 576 Ward Wilson Trail
- 121 W Main St
- 123 W Main St
- 380 School St
- 408 School St
- 370 School St
- 425 School St
- 416 School St
- 113 W Main St
- 116 W Main St
- 0 N Moore St
- 00 N Moore St
- 653 High Valley St
- 113 Barnette Rd Unit A
- 102 S Moore St
- 647 High Valley St
- 424 School St
- 112 W Main St
- 304 William Freeman Way
- 105 S Moore St
- 641 High Valley St