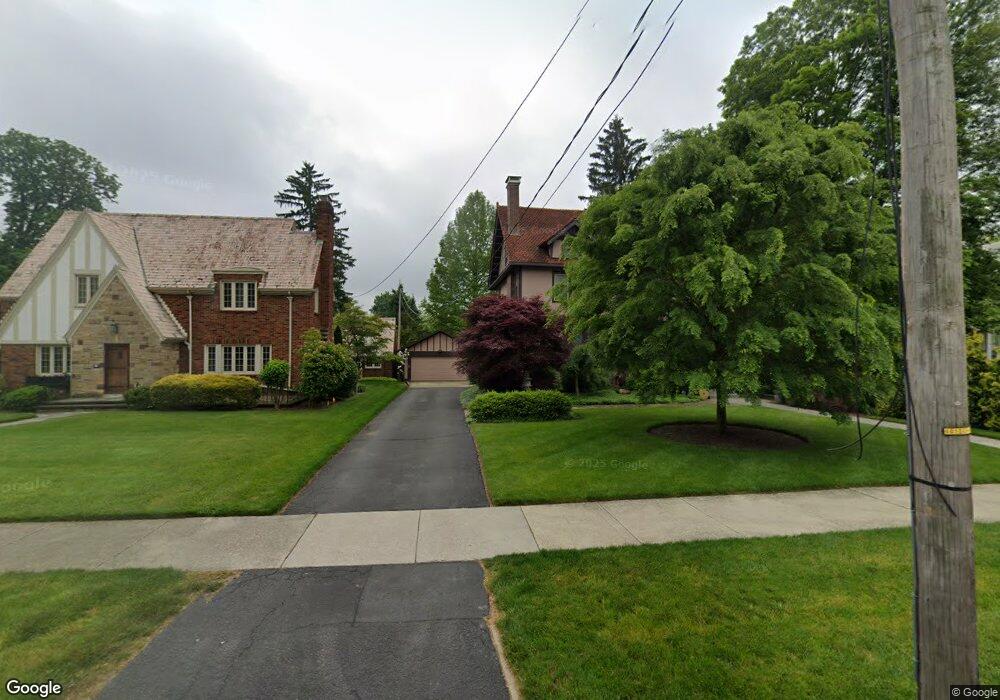
119 W Main St Norwalk, OH 44857
Estimated Value: $260,000 - $347,000
3
Beds
3
Baths
2,408
Sq Ft
$123/Sq Ft
Est. Value
About This Home
This home is located at 119 W Main St, Norwalk, OH 44857 and is currently estimated at $296,380, approximately $123 per square foot. 119 W Main St is a home located in Huron County with nearby schools including Maplehurst Elementary School, Pleasant Elementary School, and League Elementary School.
Ownership History
Date
Name
Owned For
Owner Type
Purchase Details
Closed on
Aug 14, 2009
Bought by
Michael and Pamela Kenney
Current Estimated Value
Purchase Details
Closed on
Oct 21, 2003
Bought by
Berkey Samuel R
Purchase Details
Closed on
Aug 23, 2002
Bought by
Mulchin Nick J
Purchase Details
Closed on
Apr 23, 2001
Bought by
Mulchin Nick J Trustee
Purchase Details
Closed on
May 11, 1999
Sold by
Sommer Timothy
Bought by
Mulchin Nick J
Purchase Details
Closed on
Dec 9, 1997
Bought by
Sommer Timothy
Purchase Details
Closed on
Nov 30, 1989
Bought by
Sommer Maxine D
Create a Home Valuation Report for This Property
The Home Valuation Report is an in-depth analysis detailing your home's value as well as a comparison with similar homes in the area
Home Values in the Area
Average Home Value in this Area
Purchase History
| Date | Buyer | Sale Price | Title Company |
|---|---|---|---|
| Michael | $207,500 | -- | |
| Berkey Samuel R | $205,000 | -- | |
| Mulchin Nick J | -- | -- | |
| Mulchin Nick J Trustee | -- | -- | |
| Mulchin Nick J | $150,000 | -- | |
| Sommer Timothy | -- | -- | |
| Sommer Maxine D | -- | -- |
Source: Public Records
Tax History Compared to Growth
Tax History
| Year | Tax Paid | Tax Assessment Tax Assessment Total Assessment is a certain percentage of the fair market value that is determined by local assessors to be the total taxable value of land and additions on the property. | Land | Improvement |
|---|---|---|---|---|
| 2024 | -- | $76,460 | $9,240 | $67,220 |
| 2023 | $2,253 | $65,390 | $9,240 | $56,150 |
| 2022 | $2,283 | $65,390 | $9,240 | $56,150 |
| 2021 | $2,284 | $65,390 | $9,240 | $56,150 |
| 2020 | $2,311 | $63,260 | $9,240 | $54,020 |
| 2019 | $2,260 | $63,260 | $9,240 | $54,020 |
| 2018 | $0 | $63,260 | $9,240 | $54,020 |
| 2017 | $2,096 | $60,050 | $9,240 | $50,810 |
| 2016 | $2,057 | $60,050 | $9,240 | $50,810 |
| 2015 | $2,017 | $60,060 | $9,240 | $50,820 |
| 2014 | $1,694 | $50,650 | $7,390 | $43,260 |
| 2013 | $1,472 | $50,650 | $7,390 | $43,260 |
Source: Public Records
Map
Nearby Homes