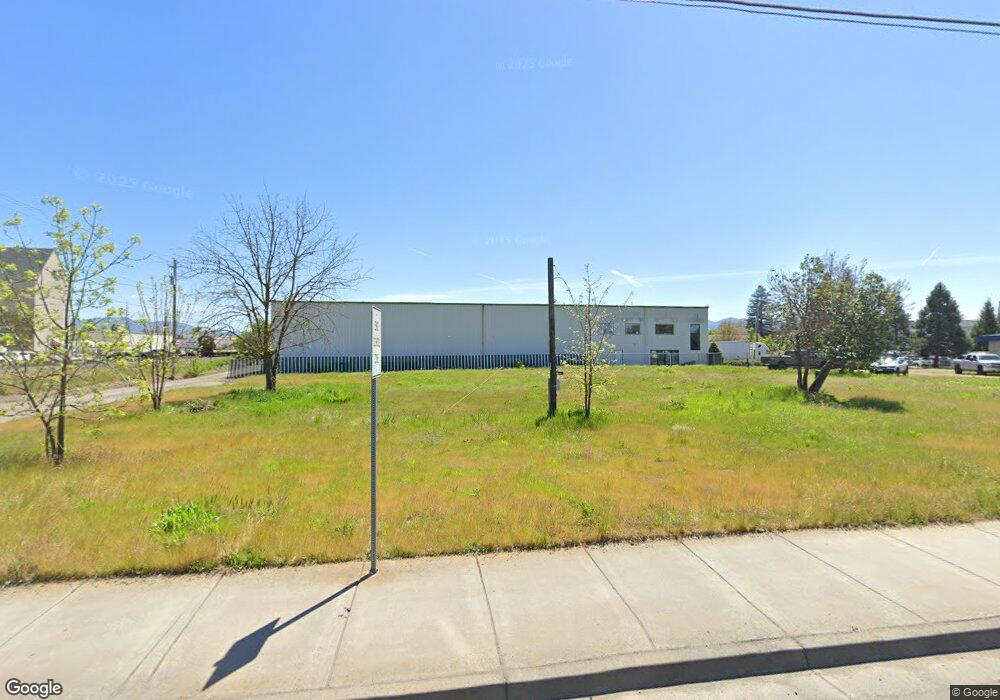
119 W Pine St Central Point, OR 97502
Estimated Value: $595,148 - $693,000
--
Bed
5
Baths
4,767
Sq Ft
$135/Sq Ft
Est. Value
About This Home
This home is located at 119 W Pine St, Central Point, OR 97502 and is currently estimated at $644,074, approximately $135 per square foot. 119 W Pine St is a home located in Jackson County with nearby schools including Richardson Elementary School, Scenic Middle School, and Crater High School.
Ownership History
Date
Name
Owned For
Owner Type
Purchase Details
Closed on
May 16, 2019
Sold by
Cumorah Holdings Llc
Bought by
Palace Industries Public Benefit Corp
Current Estimated Value
Purchase Details
Closed on
Jul 7, 2005
Sold by
Beck Patricia M
Bought by
Cumorah Holdings Llc
Home Financials for this Owner
Home Financials are based on the most recent Mortgage that was taken out on this home.
Original Mortgage
$400,000
Interest Rate
5.46%
Mortgage Type
Seller Take Back
Create a Home Valuation Report for This Property
The Home Valuation Report is an in-depth analysis detailing your home's value as well as a comparison with similar homes in the area
Home Values in the Area
Average Home Value in this Area
Purchase History
| Date | Buyer | Sale Price | Title Company |
|---|---|---|---|
| Palace Industries Public Benefit Corp | $399,000 | First American | |
| Cumorah Holdings Llc | $475,000 | Amerititle |
Source: Public Records
Mortgage History
| Date | Status | Borrower | Loan Amount |
|---|---|---|---|
| Previous Owner | Cumorah Holdings Llc | $400,000 |
Source: Public Records
Tax History Compared to Growth
Tax History
| Year | Tax Paid | Tax Assessment Tax Assessment Total Assessment is a certain percentage of the fair market value that is determined by local assessors to be the total taxable value of land and additions on the property. | Land | Improvement |
|---|---|---|---|---|
| 2025 | $2,748 | $165,280 | $165,280 | -- |
| 2024 | $2,748 | $160,470 | $160,470 | -- |
| 2023 | $2,660 | $155,800 | $155,800 | $0 |
| 2022 | $2,598 | $155,800 | $155,800 | $0 |
| 2021 | $2,523 | $151,270 | $151,270 | $0 |
| 2020 | $2,450 | $146,870 | $146,870 | $0 |
| 2019 | $2,390 | $138,450 | $138,450 | $0 |
| 2018 | $6,589 | $382,290 | $136,670 | $245,620 |
| 2017 | $6,423 | $382,290 | $136,670 | $245,620 |
| 2016 | $6,236 | $360,350 | $128,830 | $231,520 |
| 2015 | $6,017 | $360,350 | $128,830 | $231,520 |
| 2014 | $5,864 | $342,120 | $96,060 | $246,060 |
Source: Public Records
Map
Nearby Homes