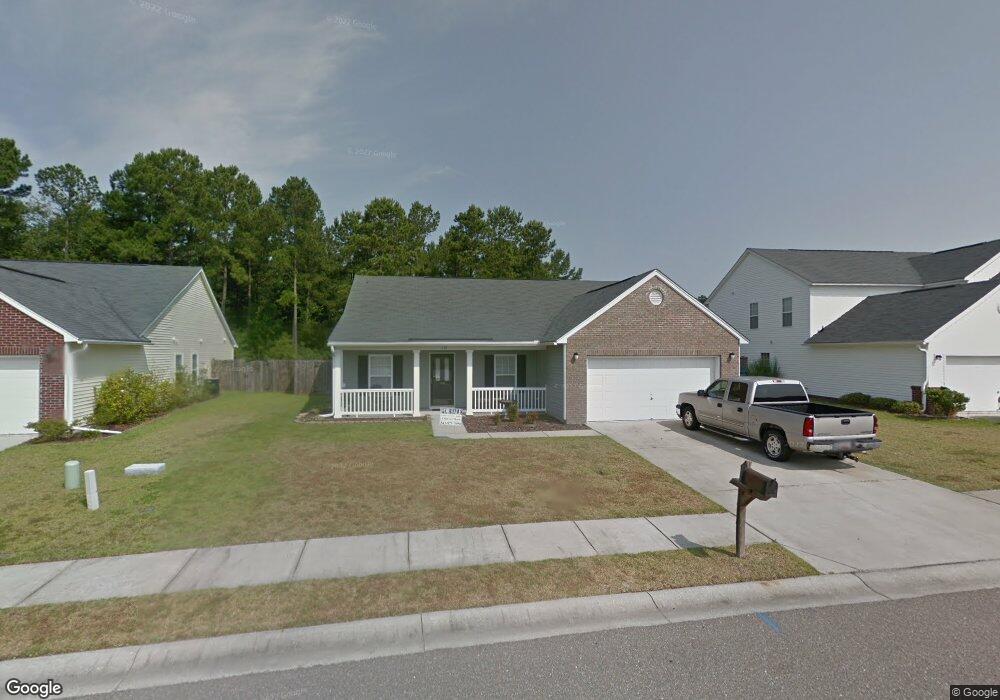
119 Waylon Dr Summerville, SC 29483
Estimated Value: $349,127 - $370,000
4
Beds
2
Baths
1,856
Sq Ft
$195/Sq Ft
Est. Value
About This Home
This home is located at 119 Waylon Dr, Summerville, SC 29483 and is currently estimated at $361,032, approximately $194 per square foot. 119 Waylon Dr is a home located in Berkeley County with nearby schools including Nexton Elementary School, Sangaree Middle School, and Cane Bay High School.
Ownership History
Date
Name
Owned For
Owner Type
Purchase Details
Closed on
Sep 9, 2022
Sold by
Mimms Mary O and Wriston Mary M
Bought by
Charles E Wriston Revocable Trust and Mary M Wriston Revocable Trust
Current Estimated Value
Purchase Details
Closed on
Aug 20, 2014
Sold by
Landry Linda K
Bought by
Community Options Inc
Home Financials for this Owner
Home Financials are based on the most recent Mortgage that was taken out on this home.
Original Mortgage
$138,320
Interest Rate
4.2%
Mortgage Type
Purchase Money Mortgage
Purchase Details
Closed on
Oct 21, 2013
Sold by
Estate Of Malcolm J Landry
Bought by
Landry Linda K
Purchase Details
Closed on
Jan 12, 2006
Sold by
Centex Homes
Bought by
Landry Malcolm J and Landry Linda K
Home Financials for this Owner
Home Financials are based on the most recent Mortgage that was taken out on this home.
Original Mortgage
$71,717
Interest Rate
6.21%
Mortgage Type
Future Advance Clause Open End Mortgage
Create a Home Valuation Report for This Property
The Home Valuation Report is an in-depth analysis detailing your home's value as well as a comparison with similar homes in the area
Home Values in the Area
Average Home Value in this Area
Purchase History
| Date | Buyer | Sale Price | Title Company |
|---|---|---|---|
| Charles E Wriston Revocable Trust | -- | None Listed On Document | |
| Community Options Inc | $172,900 | -- | |
| Landry Linda K | -- | -- | |
| Landry Malcolm J | $191,817 | None Available |
Source: Public Records
Mortgage History
| Date | Status | Borrower | Loan Amount |
|---|---|---|---|
| Previous Owner | Community Options Inc | $138,320 | |
| Previous Owner | Landry Malcolm J | $71,717 |
Source: Public Records
Tax History Compared to Growth
Tax History
| Year | Tax Paid | Tax Assessment Tax Assessment Total Assessment is a certain percentage of the fair market value that is determined by local assessors to be the total taxable value of land and additions on the property. | Land | Improvement |
|---|---|---|---|---|
| 2025 | $371 | $207,500 | $38,243 | $169,257 |
| 2024 | $347 | $12,450 | $2,295 | $10,155 |
| 2023 | $347 | $12,450 | $2,295 | $10,155 |
| 2022 | $317 | $10,826 | $1,855 | $8,971 |
| 2021 | $317 | $10,820 | $1,855 | $8,971 |
| 2020 | $241 | $10,826 | $1,855 | $8,971 |
| 2019 | $241 | $10,826 | $1,855 | $8,971 |
| 2018 | $193 | $9,414 | $2,100 | $7,314 |
| 2017 | $193 | $9,414 | $2,100 | $7,314 |
| 2016 | $177 | $9,410 | $2,100 | $7,310 |
| 2015 | $177 | $9,410 | $2,100 | $7,310 |
| 2014 | $1,939 | $6,170 | $1,400 | $4,770 |
| 2013 | -- | $6,170 | $1,400 | $4,770 |
Source: Public Records
Map
Nearby Homes
- 528 Holiday Dr
- 413 Cotton Hope Ln
- 246 Dovetail Cir
- 414 Dovetail Cir
- 219 Barnwell St
- 434 Dovetail Cir
- 441 Dovetail Cir
- 447 Cotton Hope Ln
- 114 Dovetail Cir
- 238 Avonshire Dr
- 275 Avonshire Dr
- 270 Avonshire Dr
- 127 Fripp Ln
- 135 Lilac Dr
- 131 Lilac Dr
- 129 Lilac Dr
- 131 Lilac Grove Way
- AZALEA Plan at Sheep Island
- SPRUCEWOOD Plan at Sheep Island
- HARBOR OAK Plan at Sheep Island