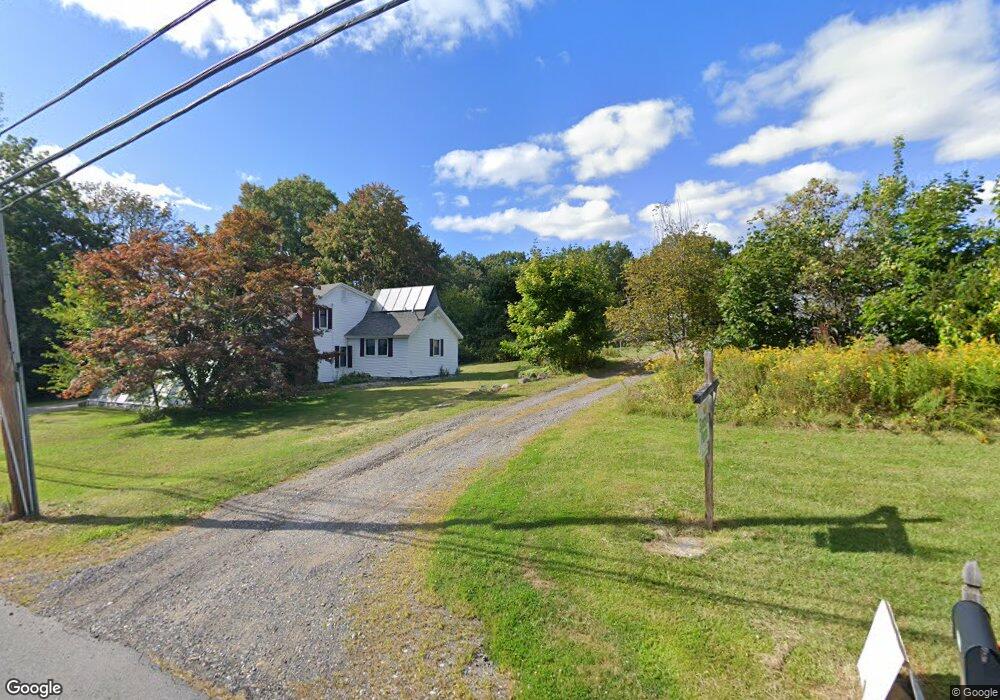
119 West St Methuen, MA 01844
The West End NeighborhoodEstimated Value: $672,347 - $730,000
4
Beds
4
Baths
2,400
Sq Ft
$292/Sq Ft
Est. Value
About This Home
This home is located at 119 West St, Methuen, MA 01844 and is currently estimated at $701,587, approximately $292 per square foot. 119 West St is a home located in Essex County with nearby schools including Marsh Grammar School, South Point Elementary School, and Methuen High School.
Ownership History
Date
Name
Owned For
Owner Type
Purchase Details
Closed on
Mar 29, 2021
Sold by
Soucy Paul B
Bought by
Tropnas Marie A and Tropnas Cesar Armael
Current Estimated Value
Home Financials for this Owner
Home Financials are based on the most recent Mortgage that was taken out on this home.
Original Mortgage
$478,225
Outstanding Balance
$429,882
Interest Rate
2.73%
Mortgage Type
FHA
Estimated Equity
$271,705
Purchase Details
Closed on
Jul 28, 2010
Sold by
Soucy Cecile M
Bought by
Soucy Paul B
Purchase Details
Closed on
Jun 18, 2002
Sold by
Soucy Cecile M
Bought by
Soucy Paul B
Purchase Details
Closed on
Jun 3, 2002
Sold by
Paul B Soucy Bldrs Inc
Bought by
Maritimes & Northeast
Purchase Details
Closed on
Jun 1, 1999
Sold by
Soucy Cecile M
Bought by
Soucy Paul B
Create a Home Valuation Report for This Property
The Home Valuation Report is an in-depth analysis detailing your home's value as well as a comparison with similar homes in the area
Home Values in the Area
Average Home Value in this Area
Purchase History
| Date | Buyer | Sale Price | Title Company |
|---|---|---|---|
| Tropnas Marie A | $495,000 | None Available | |
| Soucy Paul B | $10,000 | -- | |
| Soucy Paul B | $40,000 | -- | |
| Maritimes & Northeast | $300,000 | -- | |
| Soucy Paul B | $40,000 | -- |
Source: Public Records
Mortgage History
| Date | Status | Borrower | Loan Amount |
|---|---|---|---|
| Open | Tropnas Marie A | $478,225 | |
| Previous Owner | Soucy Paul B | $50,000 |
Source: Public Records
Tax History Compared to Growth
Tax History
| Year | Tax Paid | Tax Assessment Tax Assessment Total Assessment is a certain percentage of the fair market value that is determined by local assessors to be the total taxable value of land and additions on the property. | Land | Improvement |
|---|---|---|---|---|
| 2025 | $6,616 | $625,300 | $309,800 | $315,500 |
| 2024 | $6,428 | $591,900 | $282,900 | $309,000 |
| 2023 | $6,066 | $518,500 | $251,600 | $266,900 |
| 2022 | $5,862 | $449,200 | $210,200 | $239,000 |
| 2021 | $5,582 | $423,200 | $201,700 | $221,500 |
| 2020 | $5,571 | $414,500 | $201,700 | $212,800 |
| 2019 | $5,340 | $376,300 | $181,000 | $195,300 |
| 2018 | $5,256 | $368,300 | $181,000 | $187,300 |
| 2017 | $5,182 | $353,700 | $181,000 | $172,700 |
| 2016 | $5,041 | $340,400 | $170,600 | $169,800 |
| 2015 | $4,885 | $334,600 | $170,600 | $164,000 |
Source: Public Records
Map
Nearby Homes
- 128 West St
- 73 Myrtle St
- 96 Harris St
- 351 Peters Pond Dr
- 50 & 51 Jane St
- 280 & 290 Spring Rd
- 1 Tilbury Rd
- 5 Bailey Rd
- 1 Bridle Path Ln
- 131 Bridle Path Ln
- 100 Salem Rd
- 90 Butternut Ln
- 86 Butternut Ln
- 2 Sugar Hill Cir
- 2 Campus Rd
- 38 Butternut Ln
- 14 Tyler St
- 221 Pelham St
- 220 Pelham St
- 0 Carmel Rd Unit 6