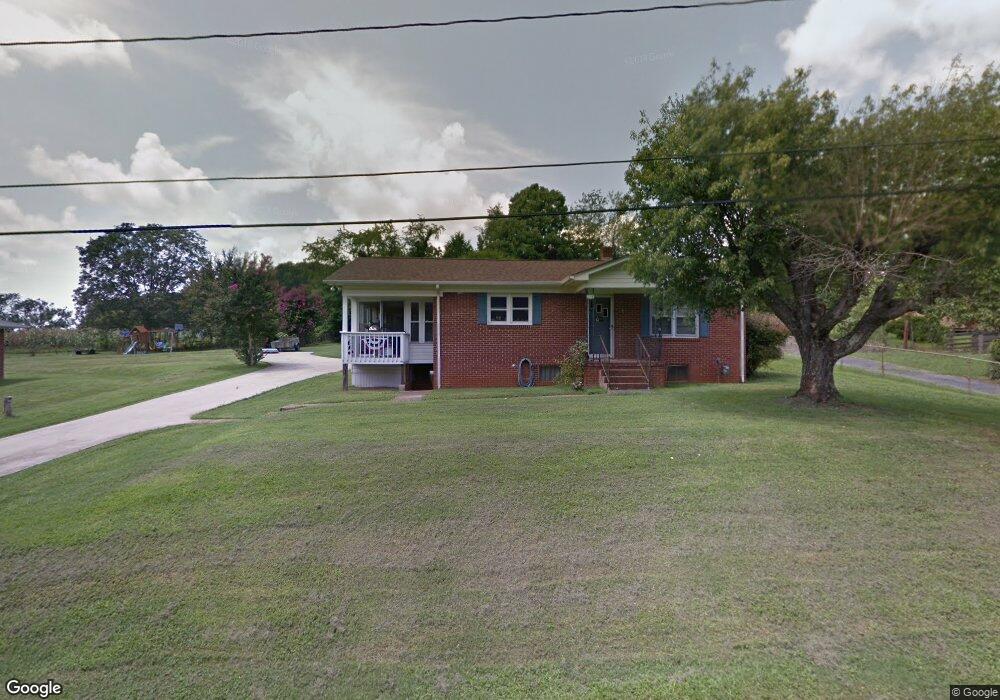
119 Whitley Rd Morganton, NC 28655
Estimated Value: $171,000 - $201,000
3
Beds
1
Bath
972
Sq Ft
$191/Sq Ft
Est. Value
About This Home
This home is located at 119 Whitley Rd, Morganton, NC 28655 and is currently estimated at $185,411, approximately $190 per square foot. 119 Whitley Rd is a home located in Burke County with nearby schools including Glen Alpine Elementary School, Table Rock Middle School, and Freedom High School.
Ownership History
Date
Name
Owned For
Owner Type
Purchase Details
Closed on
Oct 28, 2021
Sold by
Gwynn Mock Barry and Mccall Genise
Bought by
Mock Barry Gwynn and Mock Barry Gwynn
Current Estimated Value
Create a Home Valuation Report for This Property
The Home Valuation Report is an in-depth analysis detailing your home's value as well as a comparison with similar homes in the area
Home Values in the Area
Average Home Value in this Area
Purchase History
| Date | Buyer | Sale Price | Title Company |
|---|---|---|---|
| Mock Barry Gwynn | -- | None Listed On Document |
Source: Public Records
Tax History
| Year | Tax Paid | Tax Assessment Tax Assessment Total Assessment is a certain percentage of the fair market value that is determined by local assessors to be the total taxable value of land and additions on the property. | Land | Improvement |
|---|---|---|---|---|
| 2025 | $811 | $127,630 | $16,000 | $111,630 |
| 2024 | $813 | $127,630 | $16,000 | $111,630 |
| 2023 | $803 | $127,630 | $16,000 | $111,630 |
| 2022 | $702 | $89,257 | $14,000 | $75,257 |
| 2021 | $698 | $89,257 | $14,000 | $75,257 |
| 2020 | $694 | $89,257 | $14,000 | $75,257 |
| 2019 | $692 | $89,257 | $14,000 | $75,257 |
| 2018 | $695 | $89,581 | $16,000 | $73,581 |
| 2017 | $693 | $89,581 | $16,000 | $73,581 |
| 2016 | $674 | $89,581 | $16,000 | $73,581 |
| 2015 | $671 | $89,581 | $16,000 | $73,581 |
| 2014 | $670 | $89,581 | $16,000 | $73,581 |
| 2013 | $670 | $89,581 | $16,000 | $73,581 |
Source: Public Records
Map
Nearby Homes
- 204 Whitley Rd
- 104 Whitley Rd
- tbd Carbon City Rd
- tbd Carbon City Rd Unit 2
- tbd Carbon City Rd Unit 4
- 90 Elm St
- 100 Normandy Dr
- 615 Carbon City Rd
- 826 Jamestown Rd
- 112 Myrtle St
- 113 Highlander St
- 103 Emorywood Dr
- 255 Reep Dr Unit 3
- 1304 Carbon City Rd Unit 2
- 1305 Carbon City Rd Unit 3
- 227 Reep Dr
- 7777 Reep Dr Unit 3
- 8888 Reep Dr Unit 2
- 9999 Reep Dr Unit 1
- 107 Beechmont Dr
Your Personal Tour Guide
Ask me questions while you tour the home.