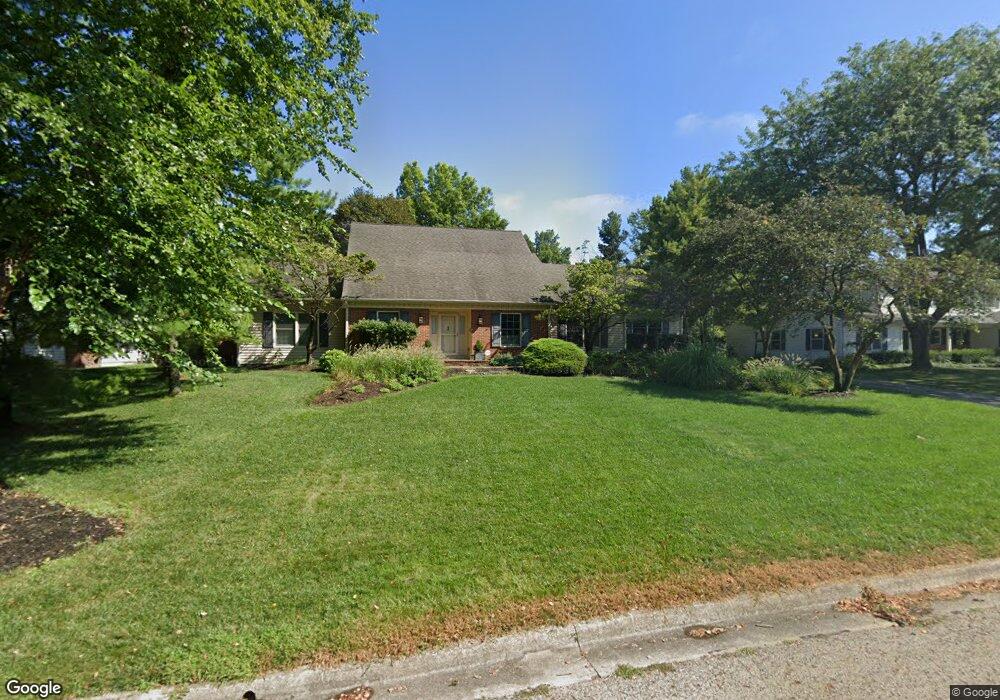
1190 Millcreek Ln Columbus, OH 43220
Estimated Value: $901,000 - $1,137,000
3
Beds
3
Baths
3,702
Sq Ft
$269/Sq Ft
Est. Value
About This Home
This home is located at 1190 Millcreek Ln, Columbus, OH 43220 and is currently estimated at $994,833, approximately $268 per square foot. 1190 Millcreek Ln is a home located in Franklin County with nearby schools including Greensview Elementary School, Hastings Middle School, and Upper Arlington High School.
Ownership History
Date
Name
Owned For
Owner Type
Purchase Details
Closed on
Jun 3, 2011
Sold by
Cross Paul K and Cross Marilyn K
Bought by
Lowe Gregory and Lowe Jessica
Current Estimated Value
Home Financials for this Owner
Home Financials are based on the most recent Mortgage that was taken out on this home.
Original Mortgage
$470,500
Outstanding Balance
$32,395
Interest Rate
4.8%
Mortgage Type
Balloon
Estimated Equity
$962,438
Purchase Details
Closed on
May 20, 1997
Sold by
George Rolland E and George Nikki L
Bought by
Cross Paul K and Cross Marilyn K
Home Financials for this Owner
Home Financials are based on the most recent Mortgage that was taken out on this home.
Original Mortgage
$280,500
Interest Rate
7.62%
Purchase Details
Closed on
Apr 1, 1986
Purchase Details
Closed on
Oct 1, 1981
Create a Home Valuation Report for This Property
The Home Valuation Report is an in-depth analysis detailing your home's value as well as a comparison with similar homes in the area
Home Values in the Area
Average Home Value in this Area
Purchase History
| Date | Buyer | Sale Price | Title Company |
|---|---|---|---|
| Lowe Gregory | $470,500 | Northeast T | |
| Cross Paul K | $330,000 | Chicago Title | |
| -- | $268,500 | -- | |
| -- | $215,000 | -- |
Source: Public Records
Mortgage History
| Date | Status | Borrower | Loan Amount |
|---|---|---|---|
| Open | Lowe Gregory | $470,500 | |
| Previous Owner | Cross Paul K | $280,500 |
Source: Public Records
Tax History Compared to Growth
Tax History
| Year | Tax Paid | Tax Assessment Tax Assessment Total Assessment is a certain percentage of the fair market value that is determined by local assessors to be the total taxable value of land and additions on the property. | Land | Improvement |
|---|---|---|---|---|
| 2024 | $15,501 | $267,750 | $80,220 | $187,530 |
| 2023 | $15,309 | $267,750 | $80,220 | $187,530 |
| 2022 | $15,983 | $228,730 | $60,550 | $168,180 |
| 2021 | $14,149 | $228,730 | $60,550 | $168,180 |
| 2020 | $14,023 | $228,730 | $60,550 | $168,180 |
| 2019 | $14,159 | $204,190 | $60,550 | $143,640 |
| 2018 | $12,689 | $204,190 | $60,550 | $143,640 |
| 2017 | $14,051 | $204,190 | $60,550 | $143,640 |
| 2016 | $11,310 | $171,050 | $49,770 | $121,280 |
| 2015 | $11,300 | $171,050 | $49,770 | $121,280 |
| 2014 | $11,313 | $171,050 | $49,770 | $121,280 |
| 2013 | $5,402 | $155,505 | $45,255 | $110,250 |
Source: Public Records
Map
Nearby Homes
- 1206 Kenbrook Hills Dr
- 1109 Millcreek Ln
- 1060 Woodmere Rd
- 1225 Brittany Ln
- 3526 Rue de Fleur Unit B18U
- 1315 La Rochelle Dr Unit B2U
- 1311 La Rochelle Dr Unit B2L
- 1059 Lambeth Dr
- 1016 Lambeth Dr
- 1310 Stoneygate Ln
- 745 Highland Dr
- 1121 Afton Rd
- 718 Highland Dr
- 4319 Kenmont Place
- 4326 Kenny Rd
- 1360 Langston Dr
- 4070 Lyon Dr
- 4094 Lyon Dr
- 1560 Pemberton Dr
- 4215 Reedbury Ln
- 1204 Millcreek Ln
- 1178 Millcreek Ln
- 1169 Regency Dr
- 1159 Regency Dr
- 3820 Beecham Ct
- 1166 Millcreek Ln
- 1218 Millcreek Ln
- 3870 Kenny Rd
- 1181 Millcreek Ln
- 1149 Regency Dr
- 1179 Regency Dr
- 3900 Kenny Rd
- 3800 Beecham Ct
- 1173 Millcreek Ln
- 1150 Millcreek Ct
- 3815 Beecham Ct
- 3808 Beecham Ct
- 1160 Regency Dr
- 1135 Regency Dr
- 1140 Regency Dr