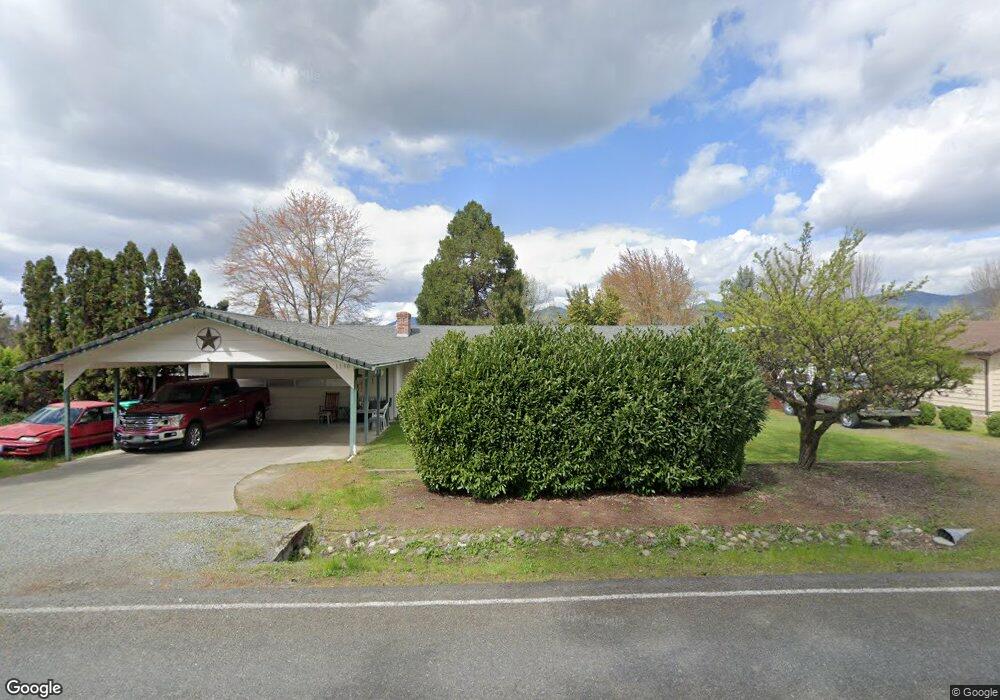
1190 Monroe Way Grants Pass, OR 97527
Estimated Value: $421,793 - $436,000
3
Beds
2
Baths
1,824
Sq Ft
$235/Sq Ft
Est. Value
About This Home
This home is located at 1190 Monroe Way, Grants Pass, OR 97527 and is currently estimated at $428,897, approximately $235 per square foot. 1190 Monroe Way is a home located in Josephine County with nearby schools including Fruitdale Elementary School, Lincoln Savage Middle School, and Hidden Valley High School.
Ownership History
Date
Name
Owned For
Owner Type
Purchase Details
Closed on
May 10, 2013
Sold by
Smith Jack E
Bought by
Smith Jack E and Smith Zachary S
Current Estimated Value
Purchase Details
Closed on
Aug 27, 2010
Sold by
Torrel Mark N and Torrel Linda L
Bought by
Smith Jack E
Purchase Details
Closed on
May 12, 2010
Sold by
Hickox Garry A and Nahale Linda
Bought by
Torrel Mark N and Torrel Linda L
Purchase Details
Closed on
Feb 20, 2009
Sold by
Nahale Linda
Bought by
Hickox Garry A
Purchase Details
Closed on
Dec 21, 2007
Sold by
Hickox Barbara F
Bought by
Nehale Linda
Purchase Details
Closed on
May 12, 2006
Sold by
Hickox Barbara F
Bought by
Hickox Barbara F
Home Financials for this Owner
Home Financials are based on the most recent Mortgage that was taken out on this home.
Original Mortgage
$38,000
Interest Rate
6.41%
Mortgage Type
Fannie Mae Freddie Mac
Create a Home Valuation Report for This Property
The Home Valuation Report is an in-depth analysis detailing your home's value as well as a comparison with similar homes in the area
Purchase History
| Date | Buyer | Sale Price | Title Company |
|---|---|---|---|
| Smith Jack E | -- | None Available | |
| Smith Jack E | $192,300 | Ticor Title Company Oregon | |
| Torrel Mark N | $54,747 | Ticor Title Company Oregon | |
| Hickox Garry A | -- | None Available | |
| Nehale Linda | -- | Accommodation | |
| Hickox Barbara F | -- | First American Title |
Source: Public Records
Mortgage History
| Date | Status | Borrower | Loan Amount |
|---|---|---|---|
| Previous Owner | Hickox Barbara F | $38,000 |
Source: Public Records
Tax History
| Year | Tax Paid | Tax Assessment Tax Assessment Total Assessment is a certain percentage of the fair market value that is determined by local assessors to be the total taxable value of land and additions on the property. | Land | Improvement |
|---|---|---|---|---|
| 2025 | $3,557 | $240,210 | -- | -- |
| 2024 | $3,557 | $233,220 | -- | -- |
| 2023 | $3,323 | $226,430 | $0 | $0 |
| 2022 | $3,333 | $219,840 | -- | -- |
| 2021 | $3,128 | $213,440 | $0 | $0 |
| 2020 | $3,098 | $207,230 | $0 | $0 |
| 2019 | $2,929 | $201,200 | $0 | $0 |
| 2018 | $2,697 | $195,340 | $0 | $0 |
| 2017 | $2,249 | $164,740 | $0 | $0 |
| 2016 | $1,975 | $159,950 | $0 | $0 |
Source: Public Records
Map
Nearby Homes
- 155 SE Champagne Ct Unit Lot7
- 1986 Kelly Way
- 1716 Gardendale Ln
- 2229 SE Linden Ln
- 2231 SE Linden Ln
- 1407 Fruitdale Dr Unit 10
- 1407 Fruitdale Dr Unit 12
- 1407 Fruitdale Dr Unit 2
- 1407 Fruitdale Dr Unit 4
- 1407 Fruitdale Dr Unit 3
- 1407 Fruitdale Dr Unit 6
- 1407 Fruitdale Dr Unit 11
- 1407 Fruitdale Dr Unit 5
- 1407 Fruitdale Dr Unit 7
- 1783 SE Brookhurst Way
- 2234 SE Linden Ln
- 495 Harper Loop
- 1125 Lee Roze Ln
- 1113 Lee Roze Ln
- 0 SE Rosemary Ln Unit 441 220208362
- 1216 Monroe Way
- 1999 Haviland Dr
- 1222 Monroe Way
- 2014 Haviland Dr
- 1211 Monroe Way
- 1975 Haviland Dr
- 2034 Haviland Dr
- 1228 Monroe Way
- 1234 Monroe Way
- 1996 Haviland Dr
- 1971 Haviland Dr
- 2040 Haviland Dr
- 2050 Mayfield Dr
- 1998 Haviland Dr
- 1161 Wylie Ln
- 2075 Haviland Dr
- 1965 Haviland Dr
- 1256 Monroe Way
- 2006 Haviland Dr
- 2036 Haviland Dr
Your Personal Tour Guide
Ask me questions while you tour the home.