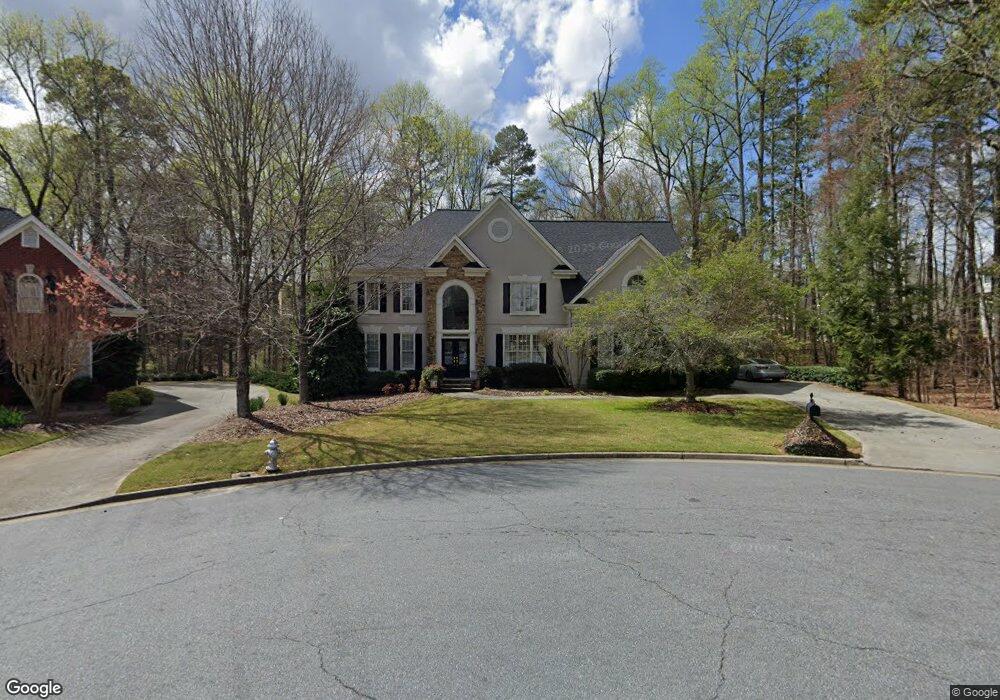
1190 Rugglestone Way Duluth, GA 30097
Estimated Value: $882,354 - $1,193,000
6
Beds
5
Baths
3,272
Sq Ft
$304/Sq Ft
Est. Value
About This Home
This home is located at 1190 Rugglestone Way, Duluth, GA 30097 and is currently estimated at $993,339, approximately $303 per square foot. 1190 Rugglestone Way is a home located in Fulton County with nearby schools including Wilson Creek Elementary School, River Trail Middle School, and Northview High School.
Ownership History
Date
Name
Owned For
Owner Type
Purchase Details
Closed on
Dec 10, 2008
Sold by
Kumar Sai R and Kumar Sudha V
Bought by
Sperry Mark D and Sperry Diane C
Current Estimated Value
Home Financials for this Owner
Home Financials are based on the most recent Mortgage that was taken out on this home.
Original Mortgage
$404,000
Outstanding Balance
$266,551
Interest Rate
6.1%
Mortgage Type
New Conventional
Estimated Equity
$726,788
Purchase Details
Closed on
Oct 12, 2004
Sold by
Kumar Sai R
Bought by
Kumar Sai R and Kumar Sudha
Home Financials for this Owner
Home Financials are based on the most recent Mortgage that was taken out on this home.
Original Mortgage
$364,000
Interest Rate
4.88%
Mortgage Type
New Conventional
Purchase Details
Closed on
Oct 8, 1997
Sold by
Jim Hogan Homes Inc
Bought by
Boneta Ii Luis B
Home Financials for this Owner
Home Financials are based on the most recent Mortgage that was taken out on this home.
Original Mortgage
$313,400
Interest Rate
7.55%
Mortgage Type
New Conventional
Create a Home Valuation Report for This Property
The Home Valuation Report is an in-depth analysis detailing your home's value as well as a comparison with similar homes in the area
Purchase History
| Date | Buyer | Sale Price | Title Company |
|---|---|---|---|
| Sperry Mark D | $505,000 | -- | |
| Kumar Sai R | -- | -- | |
| Kumar Sai R | $455,000 | -- | |
| Boneta Ii Luis B | $331,400 | -- |
Source: Public Records
Mortgage History
| Date | Status | Borrower | Loan Amount |
|---|---|---|---|
| Open | Sperry Mark D | $404,000 | |
| Previous Owner | Kumar Sai R | $364,000 | |
| Previous Owner | Boneta Ii Luis B | $313,400 |
Source: Public Records
Tax History
| Year | Tax Paid | Tax Assessment Tax Assessment Total Assessment is a certain percentage of the fair market value that is determined by local assessors to be the total taxable value of land and additions on the property. | Land | Improvement |
|---|---|---|---|---|
| 2025 | $6,247 | $345,240 | $93,280 | $251,960 |
| 2023 | $8,318 | $294,680 | $79,120 | $215,560 |
| 2022 | $5,987 | $251,720 | $68,680 | $183,040 |
| 2021 | $5,790 | $208,240 | $56,080 | $152,160 |
| 2020 | $5,775 | $199,520 | $47,240 | $152,280 |
| 2019 | $680 | $201,720 | $58,160 | $143,560 |
| 2018 | $6,017 | $197,000 | $56,800 | $140,200 |
| 2017 | $5,605 | $176,840 | $59,960 | $116,880 |
| 2016 | $5,457 | $175,080 | $59,960 | $115,120 |
| 2015 | $5,517 | $175,080 | $59,960 | $115,120 |
| 2014 | $5,104 | $157,760 | $48,160 | $109,600 |
Source: Public Records
Map
Nearby Homes
- 1195 Rugglestone Way Unit 7C
- 10895 Glenbarr Dr
- 6520 Ganton Dr
- 400 Stedford Ln
- 7020 Sweet Creek Rd
- 1305 Simonds Way
- 7080 Sweet Creek Rd
- 355 Hurst Bourne Ln
- 275 Abbotts Mill Dr Unit 18
- 850 Abbotts Mill Ct Unit 79
- 6390 Whitestone Place
- 755 Abbotts Mill Ct Unit 69
- 795 Abbotts Mill Ct Unit 73
- 4099 Abbotts Bridge Rd
- 6273 Clapham Ln
- 540 Abbotts Mill Dr
- 6578 Creekview Cir
- 10844 Yorkwood St
- 10600 Grandview Square
- 3052 Brindale Dr
- 1180 Rugglestone Way Unit 7C
- 1170 Rugglestone Way Unit 7C
- 1160 Rugglestone Way Unit 7C
- 540 Stedford Ln
- 530 Stedford Ln Unit 3B
- 550 Stedford Ln
- 705 Spencer Mill Ct Unit 7C
- 10915 Glenbarr Dr Unit 1
- 520 Stedford Ln Unit 4B
- 725 Spencer Mill Ct
- 10905 Glenbarr Dr
- 1185 Rugglestone Way
- 10885 Glenbarr Dr
- 10925 Glenbarr Dr
- 6490 Ganton Dr Unit 4B
- 560 Stedford Ln Unit 111A
- 10935 Glenbarr Dr
- 715 Spencer Mill Ct
- 10875 Glenbarr Dr Unit I
- 10865 Glenbarr Dr
Your Personal Tour Guide
Ask me questions while you tour the home.