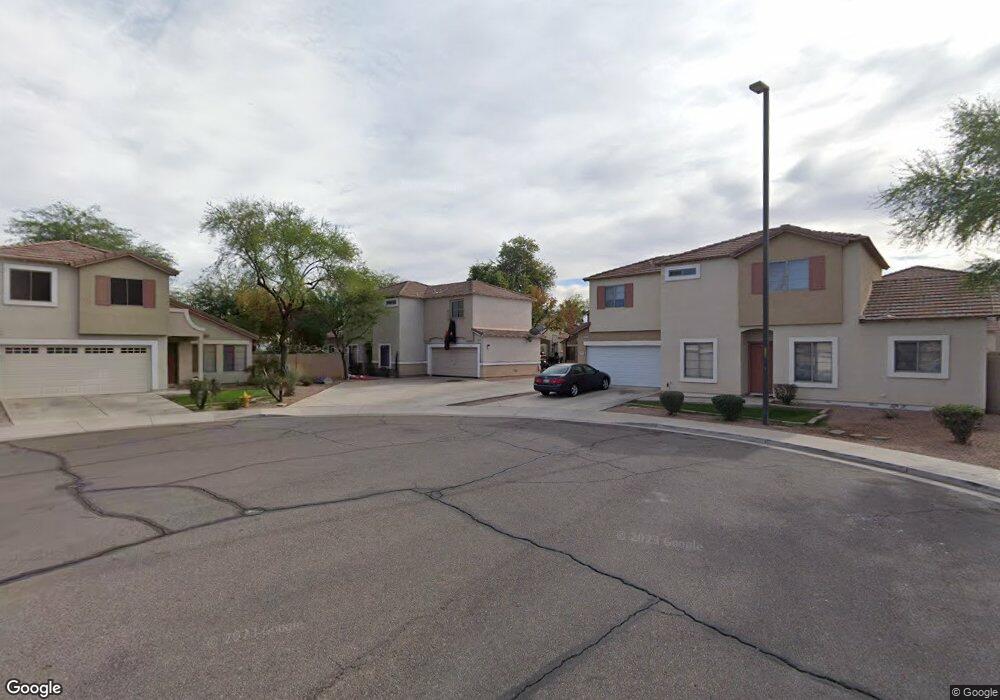
1190 S Red Rock Ct (Cds-Park N S) Ct Unit A Gilbert, AZ 85296
East Gilbert NeighborhoodEstimated Value: $411,000 - $589,000
4
Beds
3
Baths
1,661
Sq Ft
$282/Sq Ft
Est. Value
About This Home
This home is located at 1190 S Red Rock Ct (Cds-Park N S) Ct Unit A, Gilbert, AZ 85296 and is currently estimated at $468,432, approximately $282 per square foot. 1190 S Red Rock Ct (Cds-Park N S) Ct Unit A is a home located in Maricopa County with nearby schools including Mesquite Elementary School, South Valley Jr. High School, and Campo Verde High School.
Ownership History
Date
Name
Owned For
Owner Type
Purchase Details
Closed on
Dec 30, 2013
Sold by
Lee Katy
Bought by
Ossman Valentin and Ossman Izabella
Current Estimated Value
Home Financials for this Owner
Home Financials are based on the most recent Mortgage that was taken out on this home.
Original Mortgage
$136,000
Outstanding Balance
$38,500
Interest Rate
4.46%
Mortgage Type
New Conventional
Estimated Equity
$429,932
Purchase Details
Closed on
Feb 20, 2006
Sold by
Ross Steve A and Ross Luin L
Bought by
Lee Ruby L
Purchase Details
Closed on
Feb 13, 1998
Sold by
Key Construction Inc
Bought by
Ross Steve A and Ross Luin L
Home Financials for this Owner
Home Financials are based on the most recent Mortgage that was taken out on this home.
Original Mortgage
$72,250
Interest Rate
6.46%
Mortgage Type
New Conventional
Create a Home Valuation Report for This Property
The Home Valuation Report is an in-depth analysis detailing your home's value as well as a comparison with similar homes in the area
Home Values in the Area
Average Home Value in this Area
Purchase History
| Date | Buyer | Sale Price | Title Company |
|---|---|---|---|
| Ossman Valentin | $170,000 | Security Title Agency | |
| Lee Ruby L | -- | None Available | |
| Ross Steve A | $103,239 | Chicago Title Insurance Co |
Source: Public Records
Mortgage History
| Date | Status | Borrower | Loan Amount |
|---|---|---|---|
| Open | Ossman Valentin | $136,000 | |
| Previous Owner | Ross Steve A | $72,250 |
Source: Public Records
Tax History Compared to Growth
Tax History
| Year | Tax Paid | Tax Assessment Tax Assessment Total Assessment is a certain percentage of the fair market value that is determined by local assessors to be the total taxable value of land and additions on the property. | Land | Improvement |
|---|---|---|---|---|
| 2025 | $1,433 | $16,217 | -- | -- |
| 2024 | $1,440 | $15,445 | -- | -- |
| 2023 | $1,440 | $30,300 | $6,060 | $24,240 |
| 2022 | $1,399 | $22,560 | $4,510 | $18,050 |
| 2021 | $1,447 | $21,320 | $4,260 | $17,060 |
| 2020 | $1,426 | $19,300 | $3,860 | $15,440 |
| 2019 | $1,325 | $17,570 | $3,510 | $14,060 |
| 2018 | $1,289 | $16,500 | $3,300 | $13,200 |
| 2017 | $1,247 | $15,120 | $3,020 | $12,100 |
| 2016 | $1,280 | $14,400 | $2,880 | $11,520 |
| 2015 | $1,167 | $13,160 | $2,630 | $10,530 |
Source: Public Records
Map
Nearby Homes
- 1576 E Jasper Ct Unit E
- 1187 S Val Vista Dr
- 1415 E Black Diamond Dr
- 1532 E Sunrise Way
- 1079 S Western Skies Dr
- 1480 S Boulder St Unit B
- 1038 S Palomino Creek Dr Unit 1
- 1421 S Nielson St
- 15430 E Ray Rd
- 1079 E Jasper Dr
- 1572 E Dublin St
- 1157 E Temple Ct
- 1173 E Betsy Ln Unit III
- 2056 E San Tan Ct
- 1088 S Roca St
- 1648 E Palomino Dr
- 1918 E Megan St
- 557 S Lemon Ct
- 952 S Canal Dr
- 1187 S Hazel St
- 1190 S Red Rock Ct Unit D
- 1190 S Red Rock Ct Unit C
- 1190 S Red Rock Ct Unit B
- 1190 S Red Rock Ct Unit F
- 1190 S Red Rock Ct Unit E
- 1190 S Red Rock Ct Unit A
- 1190 S Red Rock Ct Unit B20
- 1190 S Red Rock Ct
- 1190 S Red Rock Ct Unit C20
- 1191 S Boulder St
- 1191 S Boulder St Unit A
- 1191 S Boulder St Unit WOW
- 1191 S Boulder St Unit C
- 1191 S Boulder St Unit 19B
- 1191 S Boulder St Unit 19C
- 1191 S Boulder St Unit 19A
- 1191 S Boulder St Unit 19D
- 1191 S Boulder St
- 1191 S Boulder St Unit B
- 1213 S Boulder St Unit A