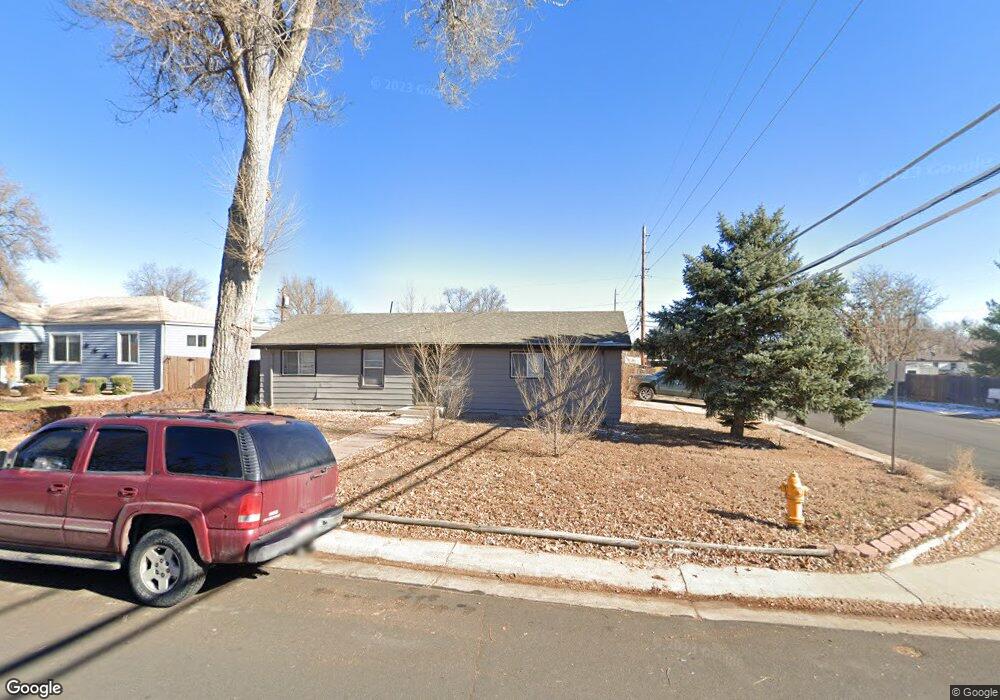
1190 S Winona Ct Denver, CO 80219
Mar Lee NeighborhoodEstimated Value: $359,000 - $444,000
2
Beds
1
Bath
893
Sq Ft
$438/Sq Ft
Est. Value
About This Home
This home is located at 1190 S Winona Ct, Denver, CO 80219 and is currently estimated at $391,388, approximately $438 per square foot. 1190 S Winona Ct is a home located in Denver County with nearby schools including Force Elementary School, Kepner Beacon Middle School, and John F Kennedy High School.
Ownership History
Date
Name
Owned For
Owner Type
Purchase Details
Closed on
Apr 11, 2019
Sold by
Wright Chad
Bought by
The Wright Properties Llc
Current Estimated Value
Purchase Details
Closed on
Jan 17, 2007
Sold by
Hud
Bought by
Wright Chad
Purchase Details
Closed on
Aug 30, 2006
Sold by
U S Bank Na
Bought by
Hud
Purchase Details
Closed on
Jul 28, 2006
Sold by
Mccaulley Debra K
Bought by
U S Bank Na
Purchase Details
Closed on
Dec 4, 2001
Sold by
Neuenkirchen Gail L and Neuenkirchen Jeffery D
Bought by
Mccaulley Debra K
Home Financials for this Owner
Home Financials are based on the most recent Mortgage that was taken out on this home.
Original Mortgage
$159,497
Interest Rate
6.59%
Mortgage Type
FHA
Purchase Details
Closed on
Apr 20, 2001
Sold by
Hinton Lea M
Bought by
Neuenkirchen Gail L and Neuenkirchen Jeffery D
Home Financials for this Owner
Home Financials are based on the most recent Mortgage that was taken out on this home.
Original Mortgage
$95,150
Interest Rate
6.81%
Create a Home Valuation Report for This Property
The Home Valuation Report is an in-depth analysis detailing your home's value as well as a comparison with similar homes in the area
Home Values in the Area
Average Home Value in this Area
Purchase History
| Date | Buyer | Sale Price | Title Company |
|---|---|---|---|
| The Wright Properties Llc | -- | None Available | |
| Wright Chad | $105,000 | None Available | |
| Hud | -- | None Available | |
| U S Bank Na | -- | None Available | |
| Mccaulley Debra K | $162,000 | -- | |
| Neuenkirchen Gail L | $105,750 | -- |
Source: Public Records
Mortgage History
| Date | Status | Borrower | Loan Amount |
|---|---|---|---|
| Previous Owner | Mccaulley Debra K | $159,497 | |
| Previous Owner | Neuenkirchen Gail L | $95,150 |
Source: Public Records
Tax History Compared to Growth
Tax History
| Year | Tax Paid | Tax Assessment Tax Assessment Total Assessment is a certain percentage of the fair market value that is determined by local assessors to be the total taxable value of land and additions on the property. | Land | Improvement |
|---|---|---|---|---|
| 2024 | $1,937 | $24,460 | $2,060 | $22,400 |
| 2023 | $1,895 | $24,460 | $2,060 | $22,400 |
| 2022 | $1,827 | $22,970 | $5,960 | $17,010 |
| 2021 | $1,763 | $23,630 | $6,130 | $17,500 |
| 2020 | $1,651 | $22,250 | $6,130 | $16,120 |
| 2019 | $1,605 | $22,250 | $6,130 | $16,120 |
| 2018 | $1,283 | $16,580 | $4,630 | $11,950 |
| 2017 | $1,279 | $16,580 | $4,630 | $11,950 |
| 2016 | $1,070 | $13,120 | $4,832 | $8,288 |
| 2015 | $1,025 | $13,120 | $4,832 | $8,288 |
| 2014 | $855 | $10,300 | $2,842 | $7,458 |
Source: Public Records
Map
Nearby Homes
- 1135 S Vrain St
- 4445 W Tennessee Ave
- 971 S Wolff St
- 1141 S Zenobia St
- 1110 S Quitman St
- 1470 S Winona Way
- 1455 S Tennyson St
- 1050 S Quitman St
- 1124 S Perry St
- 1361 S Perry St
- 1255 S Patton Ct
- 1381 S Perry St
- 1200 S Patton Ct
- 1493 S Yates St
- 1235 S Benton St
- 960 S Perry St
- 5485 W Arizona Ave
- 1470 S Quitman St
- 1057 S Osceola St
- 1255 S Chase St
- 1180 S Winona Ct
- 1200 S Winona Ct
- 1170 S Winona Ct
- 1210 S Winona Ct
- 1185 S Winona Ct
- 1205 S Winona Ct
- 1195 S Vrain St
- 1160 S Winona Ct
- 1185 S Vrain St
- 1175 S Winona Ct
- 1175 S Vrain St
- 1205 S Vrain St
- 1215 S Winona Ct
- 1220 S Winona Ct
- 1215 S Vrain St
- 1150 S Winona Ct
- 1225 S Winona Ct
- 1165 S Vrain St
- 1155 S Winona Ct
- 1225 S Vrain St