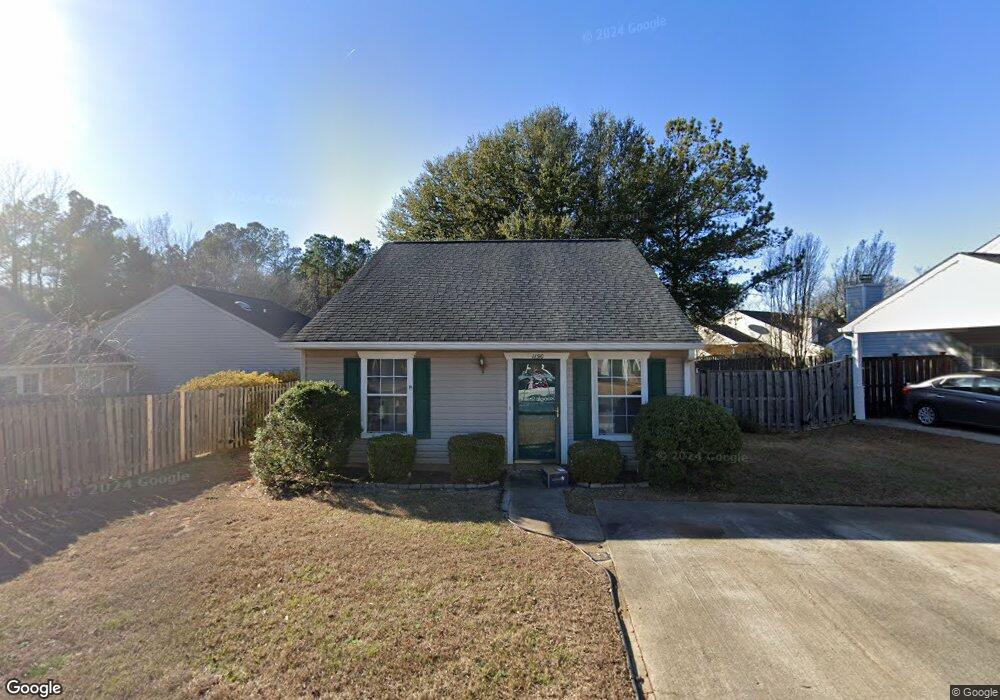
1190 Webber Way Spartanburg, SC 29307
Hillbrook NeighborhoodEstimated Value: $174,203 - $182,000
2
Beds
2
Baths
1,092
Sq Ft
$162/Sq Ft
Est. Value
About This Home
This home is located at 1190 Webber Way, Spartanburg, SC 29307 and is currently estimated at $176,551, approximately $161 per square foot. 1190 Webber Way is a home located in Spartanburg County with nearby schools including Spartanburg High School, Westminster Day School, and Spartanburg Day School.
Ownership History
Date
Name
Owned For
Owner Type
Purchase Details
Closed on
Jun 12, 2015
Sold by
Crosland Elaine and Guest Elaine B
Bought by
Wylie Andrew T
Current Estimated Value
Home Financials for this Owner
Home Financials are based on the most recent Mortgage that was taken out on this home.
Original Mortgage
$77,900
Outstanding Balance
$60,699
Interest Rate
3.92%
Mortgage Type
New Conventional
Estimated Equity
$115,852
Purchase Details
Closed on
May 24, 2010
Sold by
Adkins Norma Kay
Bought by
Guest Elaine B
Home Financials for this Owner
Home Financials are based on the most recent Mortgage that was taken out on this home.
Original Mortgage
$54,000
Interest Rate
5.15%
Mortgage Type
New Conventional
Purchase Details
Closed on
Mar 16, 2007
Sold by
Mckiernan Ruth A
Bought by
Palmer Sheila M
Purchase Details
Closed on
Nov 10, 2006
Sold by
Fore Louise B
Bought by
Mckiernan Ruth A
Create a Home Valuation Report for This Property
The Home Valuation Report is an in-depth analysis detailing your home's value as well as a comparison with similar homes in the area
Home Values in the Area
Average Home Value in this Area
Purchase History
| Date | Buyer | Sale Price | Title Company |
|---|---|---|---|
| Wylie Andrew T | $82,000 | None Available | |
| Guest Elaine B | $89,000 | -- | |
| Palmer Sheila M | -- | None Available | |
| Mckiernan Ruth A | $82,000 | None Available |
Source: Public Records
Mortgage History
| Date | Status | Borrower | Loan Amount |
|---|---|---|---|
| Open | Wylie Andrew T | $77,900 | |
| Previous Owner | Guest Elaine B | $54,000 |
Source: Public Records
Tax History Compared to Growth
Tax History
| Year | Tax Paid | Tax Assessment Tax Assessment Total Assessment is a certain percentage of the fair market value that is determined by local assessors to be the total taxable value of land and additions on the property. | Land | Improvement |
|---|---|---|---|---|
| 2025 | $1,295 | $3,933 | $1,039 | $2,894 |
| 2024 | $1,295 | $3,933 | $1,039 | $2,894 |
| 2023 | $1,295 | $3,933 | $1,039 | $2,894 |
| 2022 | $1,095 | $3,420 | $800 | $2,620 |
| 2021 | $1,095 | $3,420 | $800 | $2,620 |
| 2020 | $1,081 | $3,420 | $800 | $2,620 |
| 2019 | $1,081 | $3,420 | $800 | $2,620 |
| 2018 | $1,081 | $3,420 | $800 | $2,620 |
| 2017 | $1,055 | $3,280 | $800 | $2,480 |
| 2016 | $1,055 | $3,280 | $800 | $2,480 |
| 2015 | $486 | $3,176 | $800 | $2,376 |
| 2014 | $481 | $3,176 | $800 | $2,376 |
Source: Public Records
Map
Nearby Homes
- 1124 Webber Way
- 110 N Carleila Lake Way
- 105 N Bennington Dr
- 209 Spartina Ct
- 207 Spartina Ct
- 205 Spartina Ct
- 203 Spartina Ct
- 201 Spartina Ct
- Ashland Plan at East Main Townes
- Cary Plan at East Main Townes
- 208 Spartina Ct
- 206 Spartina Ct
- 204 Spartina Ct
- 202 Spartina Ct
- 336 S Griffin Mill Ct
- 686 Plainview Dr
- Litchfield Plan at Ransdell Pointe
- Corner Litchfield Plan at Ransdell Pointe
- 1158 Webber Way
- 1130 Webber Way
- 1128 Webber Way
- 1140 Webber Way
- 1126 Webber Way
- 1154 Webber Way
- 1142 Webber Way
- 1197 Webber Way
- 1199 Webber Way
- 1183 Webber Way
- 1131 Webber Way
- 1181 Webber Way
- 1141 Webber Way
- 1148 Webber Way
- 1146 Webber Way
- 1150 Webber Way
- 1144 Webber Way
- 1179 Webber Way
- 1152 Webber Way
- 1143 Webber Way