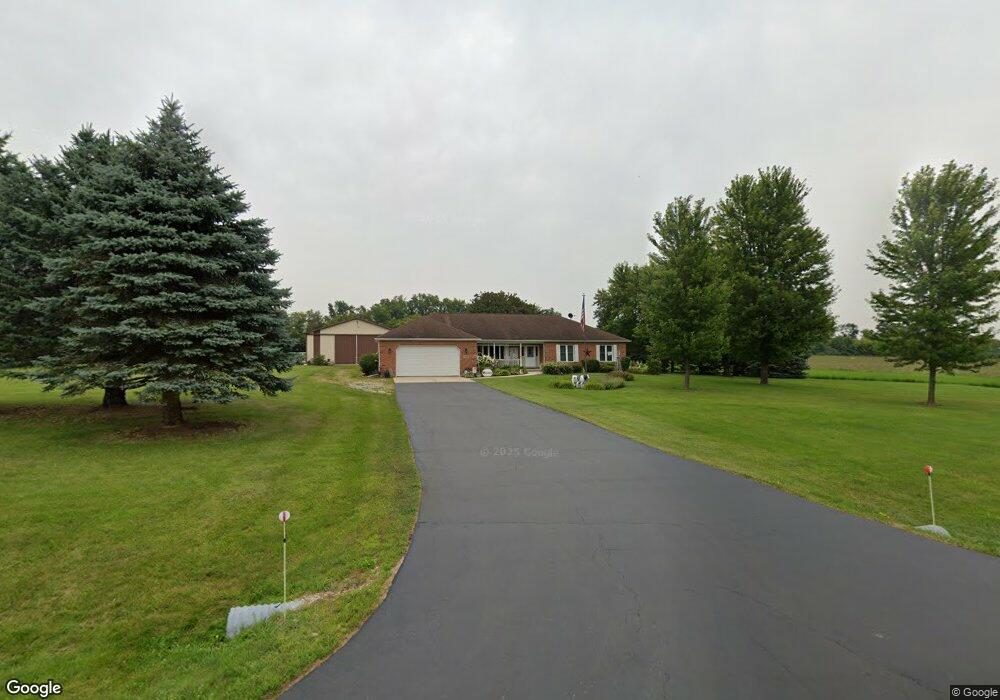
11902 Morris Dr Unit 2 Marengo, IL 60152
Riley NeighborhoodEstimated Value: $478,000 - $629,000
3
Beds
3
Baths
2,087
Sq Ft
$260/Sq Ft
Est. Value
About This Home
This home is located at 11902 Morris Dr Unit 2, Marengo, IL 60152 and is currently estimated at $542,385, approximately $259 per square foot. 11902 Morris Dr Unit 2 is a home located in McHenry County with nearby schools including Riley Community Consolidated School District 18 and Marengo Community High School.
Ownership History
Date
Name
Owned For
Owner Type
Purchase Details
Closed on
Apr 13, 2011
Sold by
Stuffle Patricia A and Koppen Patricia A
Bought by
Kohley Thomas K and Kohley Becky S
Current Estimated Value
Purchase Details
Closed on
Mar 7, 2007
Sold by
Koppen Lyle C
Bought by
Koppen Lyle C and Koppen Patricia A
Purchase Details
Closed on
Oct 19, 2006
Sold by
Koppen Lyle C
Bought by
Koppen Lyle C and Gertrude C Koppen Marital Trust
Create a Home Valuation Report for This Property
The Home Valuation Report is an in-depth analysis detailing your home's value as well as a comparison with similar homes in the area
Home Values in the Area
Average Home Value in this Area
Purchase History
| Date | Buyer | Sale Price | Title Company |
|---|---|---|---|
| Kohley Thomas K | $270,000 | Chicago Title | |
| Koppen Lyle C | -- | None Available | |
| Koppen Lyle C | -- | None Available |
Source: Public Records
Tax History Compared to Growth
Tax History
| Year | Tax Paid | Tax Assessment Tax Assessment Total Assessment is a certain percentage of the fair market value that is determined by local assessors to be the total taxable value of land and additions on the property. | Land | Improvement |
|---|---|---|---|---|
| 2024 | $5,697 | $127,347 | $17,335 | $110,012 |
| 2023 | $7,108 | $115,622 | $15,682 | $99,940 |
| 2022 | $7,550 | $103,485 | $24,885 | $78,600 |
| 2021 | $5,420 | $97,838 | $23,451 | $74,387 |
| 2020 | $7,452 | $95,408 | $22,819 | $72,589 |
| 2019 | $7,981 | $91,473 | $21,818 | $69,655 |
| 2018 | $8,626 | $99,262 | $20,809 | $78,453 |
| 2017 | $8,482 | $95,950 | $20,065 | $75,885 |
| 2016 | $8,398 | $92,462 | $19,287 | $73,175 |
| 2013 | -- | $87,340 | $18,124 | $69,216 |
Source: Public Records
Map
Nearby Homes
- LOT 3 Henry St
- Lot 4 Henry St
- 10817 Hill Crest Ln
- 0 Higgins Rd Unit Lot WP001 14289295
- 0 Church Rd Unit MRD12107441
- 18609 Pinon Trail
- 0000 Higgins Rd
- 10509 Henning Dr
- 10415 Henning Dr
- 10502 Henning Dr
- 10705 Clearwater Way
- 10702 Clearwater Way
- 10701 Clearwater Way
- 10408 Henning Dr
- 10309 Ellery Ln
- 10410 Oakdale Dr
- 11210 Pebble Dr
- 10201 Henning Dr
- 10208 Henning Dr
- 10006 Saint Andrews Dr
- 11808 Morris Dr
- 11911 Morris Dr
- 11717 Morris Dr
- lot 4 Morris Dr
- 11607 Morris Dr
- 20N015 Getty Rd
- 17817 Harmony Rd
- 20N017 Big Timber Rd
- 20N053 Big Timber Rd
- 19N975 Big Timber Rd
- 18011 Harmony Rd
- 18017 Harmony Rd
- 18005 Harmony Rd
- 17907 Harmony Rd
- 000 Big Timber Rd
- 0 Big Timber Rd
- 0 Big Timber Rd Unit 9024619
- 0 Big Timber Rd Unit 9370853
- 0 Big Timber Rd Unit 9714238
- 0 Big Timber Rd Unit 10514099