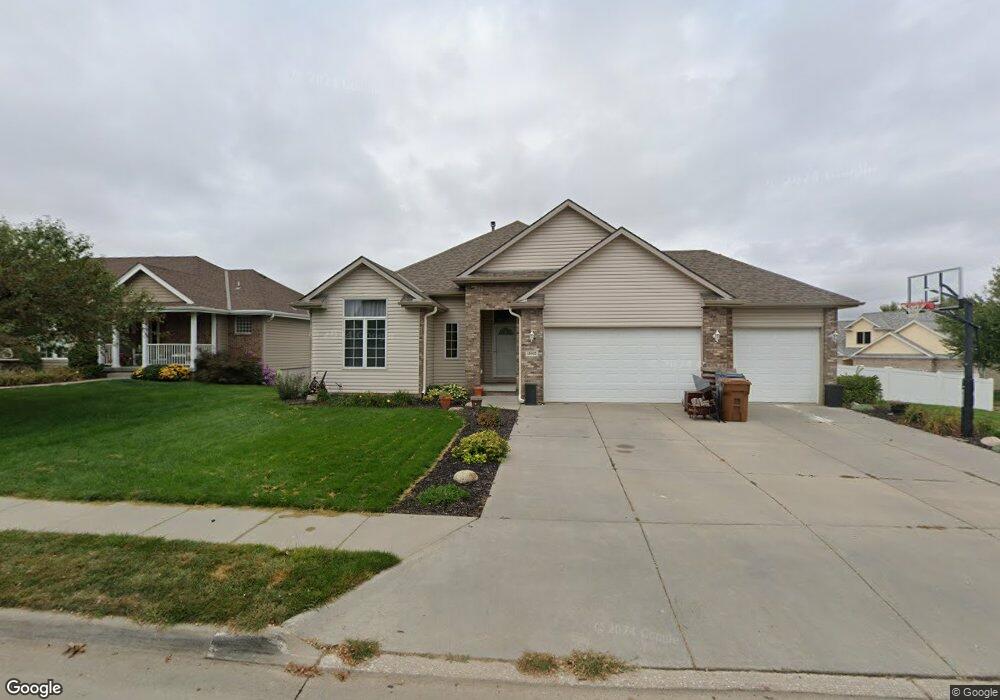
11902 S 49th St Papillion, NE 68133
Estimated Value: $432,000 - $478,000
4
Beds
3
Baths
2,865
Sq Ft
$159/Sq Ft
Est. Value
About This Home
This home is located at 11902 S 49th St, Papillion, NE 68133 and is currently estimated at $454,807, approximately $158 per square foot. 11902 S 49th St is a home located in Sarpy County with nearby schools including Bellevue Elementary School, Lewis & Clark Middle School, and Bellevue West High School.
Ownership History
Date
Name
Owned For
Owner Type
Purchase Details
Closed on
Jun 11, 2011
Sold by
Lau Henry K and Lau Kelly J
Bought by
Bryant Thomas J
Current Estimated Value
Home Financials for this Owner
Home Financials are based on the most recent Mortgage that was taken out on this home.
Original Mortgage
$193,600
Outstanding Balance
$134,151
Interest Rate
4.74%
Estimated Equity
$320,656
Purchase Details
Closed on
Jun 28, 2007
Sold by
Ingram Enterprises Inc
Bought by
Lau Henry K and Lau Kelly J
Home Financials for this Owner
Home Financials are based on the most recent Mortgage that was taken out on this home.
Original Mortgage
$234,507
Interest Rate
6.37%
Purchase Details
Closed on
Mar 30, 2005
Sold by
Dodge Lots Joint Venture
Bought by
Ingram Enterprises Inc
Create a Home Valuation Report for This Property
The Home Valuation Report is an in-depth analysis detailing your home's value as well as a comparison with similar homes in the area
Home Values in the Area
Average Home Value in this Area
Purchase History
| Date | Buyer | Sale Price | Title Company |
|---|---|---|---|
| Bryant Thomas J | $242,000 | Nlta | |
| Lau Henry K | $247,000 | Ot | |
| Ingram Enterprises Inc | $32,000 | -- |
Source: Public Records
Mortgage History
| Date | Status | Borrower | Loan Amount |
|---|---|---|---|
| Open | Bryant Thomas J | $193,600 | |
| Previous Owner | Lau Henry K | $234,507 |
Source: Public Records
Tax History Compared to Growth
Tax History
| Year | Tax Paid | Tax Assessment Tax Assessment Total Assessment is a certain percentage of the fair market value that is determined by local assessors to be the total taxable value of land and additions on the property. | Land | Improvement |
|---|---|---|---|---|
| 2025 | $6,439 | $393,523 | $64,000 | $329,523 |
| 2024 | $7,355 | $370,481 | $64,000 | $306,481 |
| 2023 | $7,355 | $348,322 | $59,000 | $289,322 |
| 2022 | $6,735 | $312,944 | $56,000 | $256,944 |
| 2021 | $6,620 | $302,421 | $56,000 | $246,421 |
| 2020 | $6,398 | $291,077 | $48,000 | $243,077 |
| 2019 | $6,345 | $281,267 | $44,000 | $237,267 |
| 2018 | $6,278 | $280,716 | $44,000 | $236,716 |
| 2017 | $6,276 | $272,598 | $44,000 | $228,598 |
| 2016 | $6,022 | $262,435 | $42,000 | $220,435 |
| 2015 | $5,890 | $257,012 | $42,000 | $215,012 |
| 2014 | $5,937 | $248,365 | $42,000 | $206,365 |
| 2012 | -- | $247,082 | $42,000 | $205,082 |
Source: Public Records
Map
Nearby Homes
- 11903 S 49th St
- 4724 Coffey St
- 11828 S 52nd St
- 4714 Coffey St
- 5004 Westlake Cir
- 4614 Windcrest Dr
- 5008 Westlake Cir
- 4556 Barksdale Dr
- 4557 Barksdale Dr
- 4552 Barksdale Dr
- 4510 Barksdale Dr
- 5114 Timberridge Dr
- 12039 S 45th Ave
- 4406 Barksdale Dr
- 12017 Daniell Rd
- 12029 Daniell Rd
- 12033 Daniell Rd
- 12037 Daniell Rd
- 4407 Amos Gates Dr
- 12105 Daniell Rd
- 11904 S 49th St
- 11906 S 49th St
- 4910 Sierra St
- 11903 Timberridge Dr
- 4906 Sierra St
- 11901 S 49th St
- 5006 Sierra St
- 11839 S 49th St
- 4820 Sierra St
- 11905 S 49th St
- 11908 S 49th St
- 11905 Timberridge Dr
- 4816 Sierra St
- 11907 S 49th St
- 4911 Coffey St
- 5005 Coffey St
- 11902 S 48th St
- 11907 Timberridge Dr
- 11838 S 48th St
- 11904 S 48th St