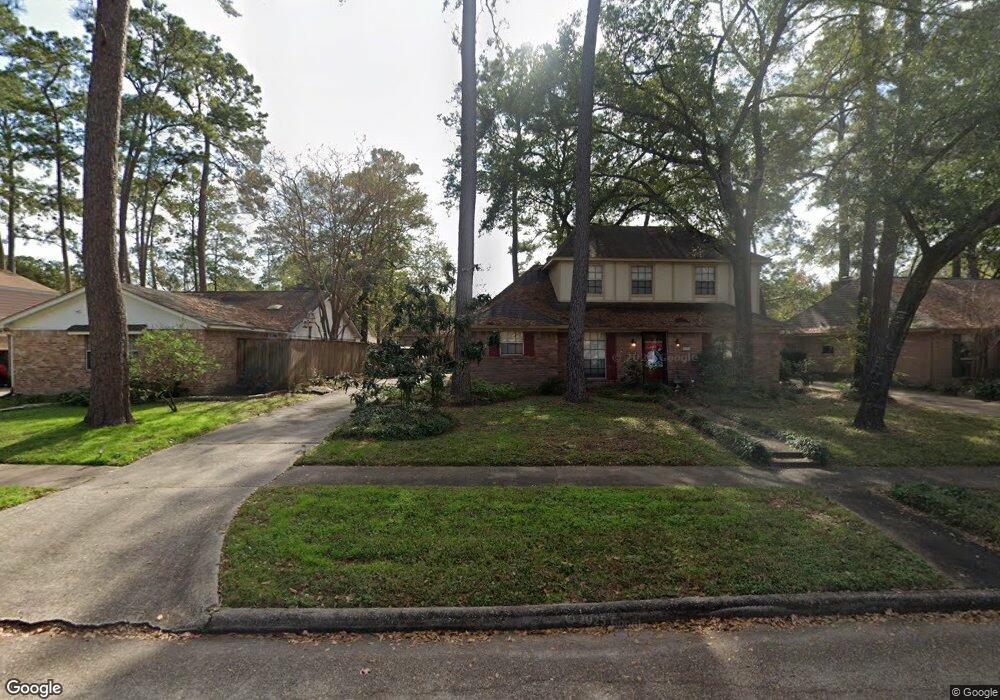
11907 Hillbrook Dr Houston, TX 77070
Estimated Value: $284,726 - $302,000
4
Beds
3
Baths
1,950
Sq Ft
$152/Sq Ft
Est. Value
About This Home
This home is located at 11907 Hillbrook Dr, Houston, TX 77070 and is currently estimated at $296,432, approximately $152 per square foot. 11907 Hillbrook Dr is a home located in Harris County with nearby schools including Lakewood Elementary School, Willow Wood Junior High School, and Northpointe Intermediate School.
Ownership History
Date
Name
Owned For
Owner Type
Purchase Details
Closed on
Nov 22, 2005
Sold by
Strahm Kimberly S
Bought by
Milner Andrew F and Milner Pamela D
Current Estimated Value
Purchase Details
Closed on
Nov 14, 2005
Sold by
Luedecke Lynn Edward
Bought by
Strahm Kimberly S
Purchase Details
Closed on
Aug 23, 2002
Sold by
Sims David D and Sims Theresa M
Bought by
Luedecke Lynn Edward and Strahm Kimberly S
Home Financials for this Owner
Home Financials are based on the most recent Mortgage that was taken out on this home.
Original Mortgage
$108,600
Interest Rate
6.47%
Purchase Details
Closed on
May 16, 2001
Sold by
Hanly Robert T and Hanly Kay M
Bought by
Sims David D and Sims Therese M
Home Financials for this Owner
Home Financials are based on the most recent Mortgage that was taken out on this home.
Original Mortgage
$98,320
Interest Rate
11.75%
Create a Home Valuation Report for This Property
The Home Valuation Report is an in-depth analysis detailing your home's value as well as a comparison with similar homes in the area
Home Values in the Area
Average Home Value in this Area
Purchase History
| Date | Buyer | Sale Price | Title Company |
|---|---|---|---|
| Milner Andrew F | -- | Startex 07 Title Company | |
| Strahm Kimberly S | -- | Startex Title Company | |
| Luedecke Lynn Edward | -- | Alamo Title Company | |
| Sims David D | -- | American Title Co |
Source: Public Records
Mortgage History
| Date | Status | Borrower | Loan Amount |
|---|---|---|---|
| Previous Owner | Luedecke Lynn Edward | $108,600 | |
| Previous Owner | Sims David D | $98,320 | |
| Closed | Luedecke Lynn Edward | $27,150 |
Source: Public Records
Tax History Compared to Growth
Tax History
| Year | Tax Paid | Tax Assessment Tax Assessment Total Assessment is a certain percentage of the fair market value that is determined by local assessors to be the total taxable value of land and additions on the property. | Land | Improvement |
|---|---|---|---|---|
| 2025 | $968 | $280,052 | $50,377 | $229,675 |
| 2024 | $968 | $266,398 | $50,377 | $216,021 |
| 2023 | $968 | $309,825 | $50,377 | $259,448 |
| 2022 | $5,167 | $267,000 | $44,629 | $222,371 |
| 2021 | $4,988 | $218,009 | $33,810 | $184,199 |
| 2020 | $4,700 | $186,579 | $33,810 | $152,769 |
| 2019 | $4,832 | $203,932 | $33,810 | $170,122 |
| 2018 | $804 | $169,000 | $24,682 | $144,318 |
| 2017 | $4,106 | $180,755 | $24,682 | $156,073 |
| 2016 | $3,733 | $145,000 | $24,682 | $120,318 |
| 2015 | $1,282 | $161,848 | $24,682 | $137,166 |
| 2014 | $1,282 | $143,105 | $24,682 | $118,423 |
Source: Public Records
Map
Nearby Homes
- 15207 Hillbrook Ct
- 15214 River Park Dr
- 15326 Gettysburg Dr
- 11814 Golden Pine Dr
- 15215 River Park Dr
- 15406 Winterhaven Dr
- 11707 Hillbrook Dr
- 15014 River Park Dr
- 15102 Rolling Oaks Dr
- 11614 Brookfalls Dr
- 15420 Winterhaven Dr
- 15118 Stillcreek Dr
- 11926 Brandy Ln
- 15415 Kenny Dr
- 15418 Waldwick Dr
- 11715 Park Creek Dr
- 15522 Waldwick Dr
- 15627 Gettysburg Dr
- 14918 Shady Bend Dr
- 15603 Lakewood Terrace Dr
- 11903 Hillbrook Dr
- 11911 Hillbrook Dr
- 11902 Stillwater Dr
- 11843 Hillbrook Dr
- 11915 Hillbrook Dr
- 11906 Stillwater Dr
- 11842 Stillwater Dr
- 15202 Hillbrook Ct
- 11910 Stillwater Dr
- 11919 Hillbrook Dr
- 11839 Hillbrook Dr
- 11902 Hillbrook Dr
- 11914 Stillwater Dr
- 11842 Hillbrook Dr
- 11834 Stillwater Dr
- 15206 Hillbrook Ct
- 11923 Hillbrook Dr
- 11835 Hillbrook Dr
- 11838 Hillbrook Dr
- 11918 Stillwater Dr