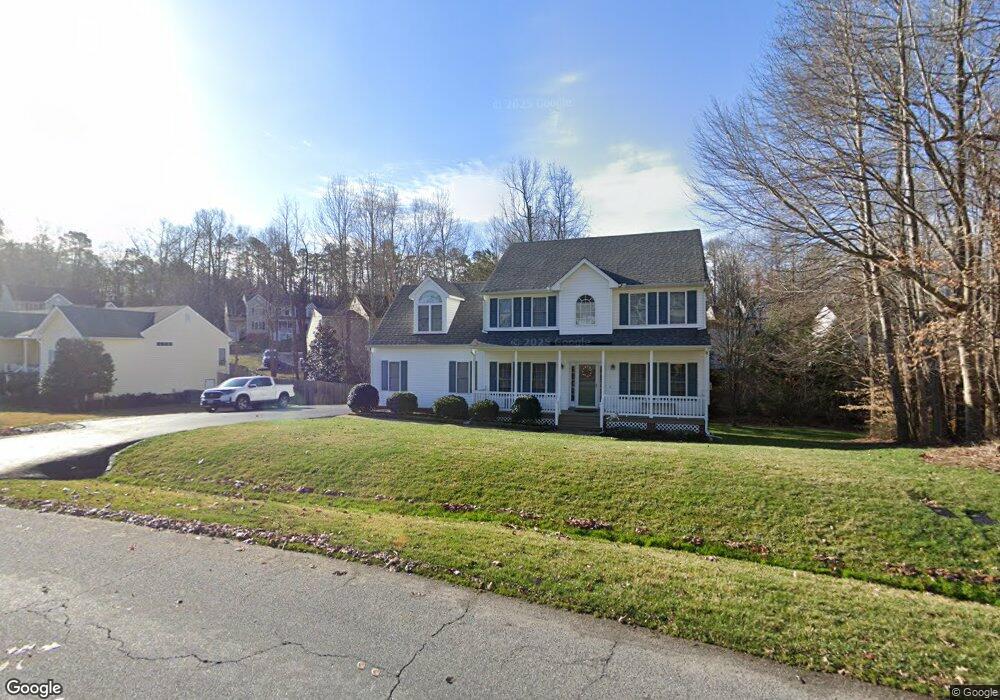
11907 Swift Crossing Dr Midlothian, VA 23112
Estimated Value: $444,000 - $461,000
4
Beds
3
Baths
2,400
Sq Ft
$189/Sq Ft
Est. Value
About This Home
This home is located at 11907 Swift Crossing Dr, Midlothian, VA 23112 and is currently estimated at $452,903, approximately $188 per square foot. 11907 Swift Crossing Dr is a home located in Chesterfield County with nearby schools including Thelma Crenshaw Elementary School, Bailey Bridge Middle School, and Manchester High.
Ownership History
Date
Name
Owned For
Owner Type
Purchase Details
Closed on
Jul 28, 2017
Sold by
Hausler David W and Hausler Heather L
Bought by
Hausler David W and Hausler Heather L
Current Estimated Value
Purchase Details
Closed on
May 12, 2004
Sold by
Quinn Construction Inc
Bought by
Hausler David W
Home Financials for this Owner
Home Financials are based on the most recent Mortgage that was taken out on this home.
Original Mortgage
$214,568
Interest Rate
5.94%
Mortgage Type
VA
Purchase Details
Closed on
May 2, 2004
Sold by
Quinn Construction Inc
Bought by
Grizzard Jerr
Home Financials for this Owner
Home Financials are based on the most recent Mortgage that was taken out on this home.
Original Mortgage
$214,568
Interest Rate
5.94%
Mortgage Type
VA
Create a Home Valuation Report for This Property
The Home Valuation Report is an in-depth analysis detailing your home's value as well as a comparison with similar homes in the area
Home Values in the Area
Average Home Value in this Area
Purchase History
| Date | Buyer | Sale Price | Title Company |
|---|---|---|---|
| Hausler David W | -- | None Available | |
| Hausler David W | $209,950 | -- | |
| Grizzard Jerr | $200,872 | -- |
Source: Public Records
Mortgage History
| Date | Status | Borrower | Loan Amount |
|---|---|---|---|
| Previous Owner | Hausler David W | $214,568 | |
| Previous Owner | Grizzard Jerr | $200,850 |
Source: Public Records
Tax History Compared to Growth
Tax History
| Year | Tax Paid | Tax Assessment Tax Assessment Total Assessment is a certain percentage of the fair market value that is determined by local assessors to be the total taxable value of land and additions on the property. | Land | Improvement |
|---|---|---|---|---|
| 2025 | $3,583 | $399,800 | $72,000 | $327,800 |
| 2024 | $3,583 | $382,700 | $69,000 | $313,700 |
| 2023 | $3,332 | $366,200 | $66,000 | $300,200 |
| 2022 | $3,145 | $341,800 | $64,000 | $277,800 |
| 2021 | $2,804 | $292,500 | $61,000 | $231,500 |
| 2020 | $2,621 | $275,900 | $60,000 | $215,900 |
| 2019 | $2,573 | $270,800 | $58,000 | $212,800 |
| 2018 | $2,441 | $256,900 | $57,000 | $199,900 |
| 2017 | $2,308 | $240,400 | $57,000 | $183,400 |
| 2016 | $2,308 | $240,400 | $57,000 | $183,400 |
| 2015 | $2,361 | $243,300 | $57,000 | $186,300 |
| 2014 | $2,142 | $220,500 | $57,000 | $163,500 |
Source: Public Records
Map
Nearby Homes
- 5019 Misty Spring Dr
- 5000 Misty Spring Dr
- 5500 Creek Crossing Dr
- 12219 Old Bailey Bridge Rd
- 11701 Clear Ridge Dr
- 5324 Sandy Ridge Ct
- 5313 Sandy Ridge Ct
- 6301 Cedar Springs Rd
- 4524 Glen Tara Dr
- 5112 Twelveoaks Rd
- 4917 Bailey Woods Ln
- 11449 Bailey Mountain Trail
- 10709 Solaris Ct
- The Rosewood Plan at Cosby Estates
- The Dogwood Plan at Cosby Estates
- The Bradford Plan at Cosby Estates
- The Magnolia Plan at Cosby Estates
- The Busch Plan at Cosby Estates
- The Portsmouth Plan at Cosby Estates
- The Harvick Plan at Cosby Estates
- 11903 Swift Crossing Dr
- 11913 Swift Crossing Dr
- 5200 Misty Spring Dr
- 5212 Misty Spring Dr
- 5224 Misty Spring Dr
- 5230 Misty Spring Dr
- 11906 Swift Crossing Dr
- 11900 Swift Crossing Dr
- 11919 Swift Crossing Dr
- 11918 Swift Crossing Dr
- 5213 Misty Spring Dr
- 5201 Misty Spring Dr
- 11925 Swift Crossing Dr
- 5119 Misty Spring Dr
- 5225 Misty Spring Dr
- 11924 Swift Crossing Dr
- 5207 Misty Spring Dr
- 5219 Misty Spring Dr
- 5106 Misty Spring Dr
- 5231 Misty Spring Dr