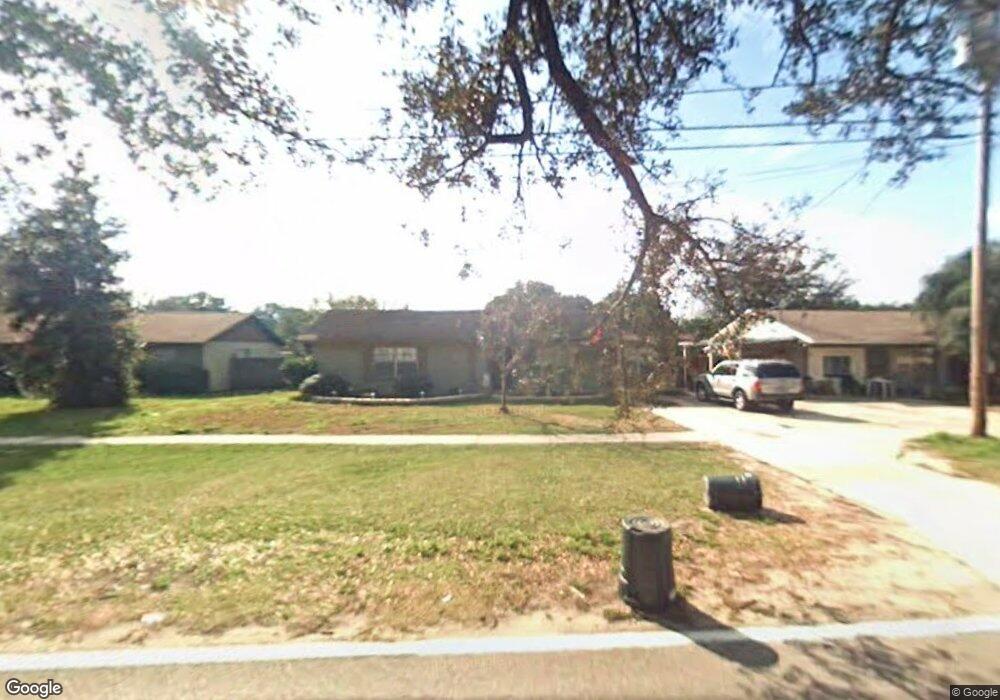
11909 Clay Pit Rd Seffner, FL 33584
Estimated Value: $270,000 - $331,000
2
Beds
1
Bath
1,425
Sq Ft
$210/Sq Ft
Est. Value
About This Home
This home is located at 11909 Clay Pit Rd, Seffner, FL 33584 and is currently estimated at $298,650, approximately $209 per square foot. 11909 Clay Pit Rd is a home located in Hillsborough County with nearby schools including Mango Elementary School, Burnett Middle School, and Armwood High School.
Ownership History
Date
Name
Owned For
Owner Type
Purchase Details
Closed on
Mar 31, 2005
Sold by
Pollock Melanie M
Bought by
Short Paul R and Short Janice J
Current Estimated Value
Home Financials for this Owner
Home Financials are based on the most recent Mortgage that was taken out on this home.
Original Mortgage
$104,000
Outstanding Balance
$54,287
Interest Rate
6.37%
Mortgage Type
Unknown
Estimated Equity
$244,363
Purchase Details
Closed on
Dec 2, 2004
Sold by
Lukacs Susan M and Bessette Susan M
Bought by
Pollock Melonie M
Purchase Details
Closed on
Sep 9, 2004
Sold by
Bessette Allie
Bought by
Pollack Melonie
Purchase Details
Closed on
Apr 21, 2004
Sold by
Bessette Allie
Bought by
Pollack Melonie
Purchase Details
Closed on
Jun 13, 2002
Sold by
Spotts Clifford D and Spotts K
Bought by
Bessette Allie and Bessette Susan M
Home Financials for this Owner
Home Financials are based on the most recent Mortgage that was taken out on this home.
Original Mortgage
$85,000
Interest Rate
6.77%
Mortgage Type
New Conventional
Create a Home Valuation Report for This Property
The Home Valuation Report is an in-depth analysis detailing your home's value as well as a comparison with similar homes in the area
Home Values in the Area
Average Home Value in this Area
Purchase History
| Date | Buyer | Sale Price | Title Company |
|---|---|---|---|
| Short Paul R | $130,000 | Alpha Omega Title Svcs Inc | |
| Pollock Melonie M | -- | -- | |
| Pollack Melonie | -- | -- | |
| Pollack Melonie | -- | -- | |
| Bessette Allie | $85,000 | -- |
Source: Public Records
Mortgage History
| Date | Status | Borrower | Loan Amount |
|---|---|---|---|
| Open | Short Paul R | $104,000 | |
| Previous Owner | Bessette Allie | $85,000 |
Source: Public Records
Tax History
| Year | Tax Paid | Tax Assessment Tax Assessment Total Assessment is a certain percentage of the fair market value that is determined by local assessors to be the total taxable value of land and additions on the property. | Land | Improvement |
|---|---|---|---|---|
| 2025 | $3,679 | $201,417 | $65,152 | $136,265 |
| 2024 | $3,679 | $199,501 | $61,320 | $138,181 |
| 2023 | $3,450 | $195,799 | $61,320 | $134,479 |
| 2022 | $3,223 | $197,739 | $53,655 | $144,084 |
| 2021 | $2,740 | $131,495 | $38,325 | $93,170 |
| 2020 | $2,537 | $127,815 | $30,660 | $97,155 |
| 2019 | $2,341 | $121,053 | $30,660 | $90,393 |
| 2018 | $2,188 | $115,112 | $0 | $0 |
| 2017 | $2,005 | $100,122 | $0 | $0 |
| 2016 | $1,802 | $76,426 | $0 | $0 |
| 2015 | $1,655 | $69,478 | $0 | $0 |
| 2014 | $1,609 | $67,604 | $0 | $0 |
| 2013 | -- | $67,065 | $0 | $0 |
Source: Public Records
Map
Nearby Homes
- 5207 Peach Ave
- 5209 Lime Ave
- 5226 Lime Ave
- 5230 Cherry Ave
- 5232 Pine St
- 0 Lime Ave
- 5020 Pine St
- 1013 Oakhill St
- 5320 Cherry Ave
- 0 S Taylor Rd
- 1004 Melrose St
- 00 S Taylor Rd
- 5341 Coldpine Place
- 5343 Coldpine Place
- 5347 Coldpine Place
- 5349 Coldpine Place
- 11767 Blackbrook Ct
- 11765 Blackbrook Ct
- 11769 Blackbrook Ct
- 902 Two Houses Ln
- 11907 Clay Pit Rd
- 11911 Clay Pit Rd
- 1301 Oak Valley Dr
- 1241 Oak Valley Dr
- 11905 Clay Pit Rd
- 11913 Clay Pit Rd
- 1303 Oak Valley Dr
- 5203 Lemon Ave
- 1239 Oak Valley Dr
- 11914 Clay Pit Rd
- 5202 Lemon Ave
- 5207 Lemon Ave
- 5206 Lemon Ave
- 11903 Clay Pit Rd
- 1321 Oakhill St
- 1305 Oak Valley Dr
- 1319 Oakhill St
- 1306 Oak Valley Dr Unit 1
- 5205 Lemon Ave
- 5208 Lemon Ave
Your Personal Tour Guide
Ask me questions while you tour the home.