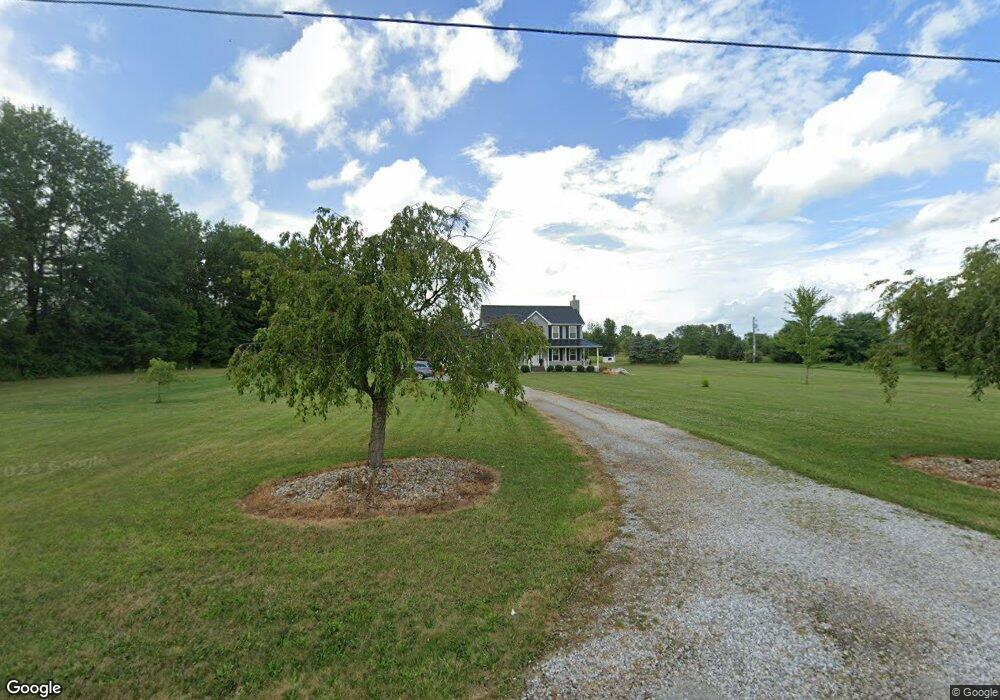
1191 Dent Rd Sunbury, OH 43074
Trenton NeighborhoodEstimated Value: $455,000 - $571,537
4
Beds
3
Baths
2,800
Sq Ft
$186/Sq Ft
Est. Value
About This Home
This home is located at 1191 Dent Rd, Sunbury, OH 43074 and is currently estimated at $521,384, approximately $186 per square foot. 1191 Dent Rd is a home located in Delaware County with nearby schools including Big Walnut Intermediate School, Big Walnut Middle School, and Big Walnut High School.
Ownership History
Date
Name
Owned For
Owner Type
Purchase Details
Closed on
Apr 19, 2011
Sold by
Maxeiner Chad E and Maxeiner Erica L
Bought by
Creitz Joseph T and Flaherty Meghan C
Current Estimated Value
Home Financials for this Owner
Home Financials are based on the most recent Mortgage that was taken out on this home.
Original Mortgage
$180,285
Outstanding Balance
$124,089
Interest Rate
4.75%
Mortgage Type
FHA
Estimated Equity
$397,295
Purchase Details
Closed on
Aug 19, 1998
Sold by
Silver Creek Homes Ltd
Bought by
Maxeiner Chad E and Maxeiner Erica L
Home Financials for this Owner
Home Financials are based on the most recent Mortgage that was taken out on this home.
Original Mortgage
$151,300
Interest Rate
6.99%
Mortgage Type
New Conventional
Purchase Details
Closed on
Mar 23, 1998
Sold by
Maxeiner Erica L
Bought by
Silver Creek Homes Inc
Create a Home Valuation Report for This Property
The Home Valuation Report is an in-depth analysis detailing your home's value as well as a comparison with similar homes in the area
Home Values in the Area
Average Home Value in this Area
Purchase History
| Date | Buyer | Sale Price | Title Company |
|---|---|---|---|
| Creitz Joseph T | $185,000 | Talon Title | |
| Maxeiner Chad E | $179,213 | -- | |
| Silver Creek Homes Inc | $26,834 | -- |
Source: Public Records
Mortgage History
| Date | Status | Borrower | Loan Amount |
|---|---|---|---|
| Open | Creitz Joseph T | $180,285 | |
| Closed | Maxeiner Chad E | $151,300 |
Source: Public Records
Tax History Compared to Growth
Tax History
| Year | Tax Paid | Tax Assessment Tax Assessment Total Assessment is a certain percentage of the fair market value that is determined by local assessors to be the total taxable value of land and additions on the property. | Land | Improvement |
|---|---|---|---|---|
| 2024 | $5,892 | $143,720 | $34,480 | $109,240 |
| 2023 | $5,754 | $143,720 | $34,480 | $109,240 |
| 2022 | $5,369 | $116,660 | $32,060 | $84,600 |
| 2021 | $5,294 | $116,660 | $32,060 | $84,600 |
| 2020 | $5,314 | $116,660 | $32,060 | $84,600 |
| 2019 | $4,475 | $94,570 | $22,890 | $71,680 |
| 2018 | $4,214 | $94,570 | $22,890 | $71,680 |
| 2017 | $3,727 | $85,270 | $18,450 | $66,820 |
| 2016 | $3,419 | $85,270 | $18,450 | $66,820 |
| 2015 | $3,440 | $85,270 | $18,450 | $66,820 |
| 2014 | $3,566 | $85,270 | $18,450 | $66,820 |
| 2013 | $3,736 | $82,710 | $18,450 | $64,260 |
Source: Public Records
Map
Nearby Homes
- 0 Piper Place Unit 316 225024755
- 0 Olive Ct Unit 311 225024758
- Erwine Residence Plan at The Oaks at Big Walnut
- Sawyer Plan at The Oaks at Big Walnut
- DeLuca Residence Plan at The Oaks at Big Walnut
- Beckner Residence Plan at The Oaks at Big Walnut
- Izabella Plan at The Oaks at Big Walnut
- Froehlich Residence Plan at The Oaks at Big Walnut
- Carroll Residence Plan at The Oaks at Big Walnut
- Barnard Residence Plan at The Oaks at Big Walnut
- 2018 Parade of Homes | Eversole Run at Jerome Village Plan at The Oaks at Big Walnut
- Wilson Residence Plan at The Oaks at Big Walnut
- 2014 Parade of Homes | Trail's End Plan at The Oaks at Big Walnut
- Roby Residence Plan at The Oaks at Big Walnut
- 2019 Parade of Homes | Evans Farm Central Plan at The Oaks at Big Walnut
- Gia Plan at The Oaks at Big Walnut
- Keene Residence Plan at The Oaks at Big Walnut
- The Iris Residence Plan at The Oaks at Big Walnut
- Woodyard Residence Plan at The Oaks at Big Walnut
- 2016 Parade of Homes | Verona Plan at The Oaks at Big Walnut