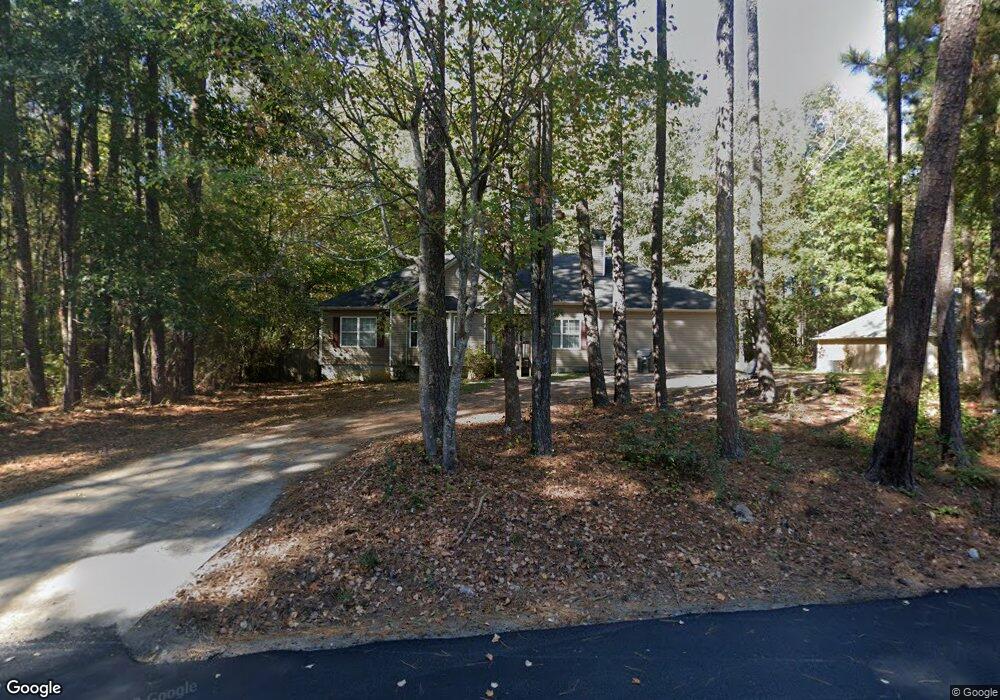
1191 Maple St SE Conyers, GA 30013
Estimated Value: $250,000 - $295,000
3
Beds
2
Baths
1,694
Sq Ft
$158/Sq Ft
Est. Value
About This Home
This home is located at 1191 Maple St SE, Conyers, GA 30013 and is currently estimated at $266,900, approximately $157 per square foot. 1191 Maple St SE is a home located in Rockdale County with nearby schools including Flat Shoals Elementary School, Memorial Middle School, and Salem High School.
Ownership History
Date
Name
Owned For
Owner Type
Purchase Details
Closed on
Feb 26, 2008
Sold by
Novastar Mortgage Inc
Bought by
Caples Yvonne D
Current Estimated Value
Home Financials for this Owner
Home Financials are based on the most recent Mortgage that was taken out on this home.
Original Mortgage
$115,090
Outstanding Balance
$72,580
Interest Rate
5.97%
Mortgage Type
FHA
Estimated Equity
$194,320
Purchase Details
Closed on
May 1, 2007
Sold by
Burns Randy
Bought by
Novastar Mortgage Inc
Purchase Details
Closed on
Apr 26, 2006
Sold by
Flowers Lonnie
Bought by
Burns Randy
Home Financials for this Owner
Home Financials are based on the most recent Mortgage that was taken out on this home.
Original Mortgage
$161,500
Interest Rate
10.04%
Mortgage Type
New Conventional
Purchase Details
Closed on
Aug 5, 2005
Sold by
White Ferne W
Bought by
Flowers Lonnie
Home Financials for this Owner
Home Financials are based on the most recent Mortgage that was taken out on this home.
Original Mortgage
$108,750
Interest Rate
5.48%
Create a Home Valuation Report for This Property
The Home Valuation Report is an in-depth analysis detailing your home's value as well as a comparison with similar homes in the area
Home Values in the Area
Average Home Value in this Area
Purchase History
| Date | Buyer | Sale Price | Title Company |
|---|---|---|---|
| Caples Yvonne D | $116,000 | -- | |
| Novastar Mortgage Inc | $149,462 | -- | |
| Burns Randy | $170,000 | -- | |
| Flowers Lonnie | $23,700 | -- |
Source: Public Records
Mortgage History
| Date | Status | Borrower | Loan Amount |
|---|---|---|---|
| Open | Caples Yvonne D | $115,090 | |
| Previous Owner | Burns Randy | $161,500 | |
| Previous Owner | Flowers Lonnie | $108,750 |
Source: Public Records
Tax History Compared to Growth
Tax History
| Year | Tax Paid | Tax Assessment Tax Assessment Total Assessment is a certain percentage of the fair market value that is determined by local assessors to be the total taxable value of land and additions on the property. | Land | Improvement |
|---|---|---|---|---|
| 2024 | $3,059 | $125,800 | $20,800 | $105,000 |
| 2023 | $2,803 | $119,760 | $20,800 | $98,960 |
| 2022 | $2,304 | $100,320 | $18,440 | $81,880 |
| 2021 | $1,831 | $77,360 | $10,000 | $67,360 |
| 2020 | $1,581 | $67,680 | $8,400 | $59,280 |
| 2019 | $1,230 | $55,000 | $6,600 | $48,400 |
| 2018 | $1,238 | $55,000 | $6,600 | $48,400 |
| 2017 | $1,195 | $53,080 | $6,600 | $46,480 |
| 2016 | $749 | $40,880 | $5,120 | $35,760 |
| 2015 | $723 | $39,920 | $4,160 | $35,760 |
| 2014 | $649 | $39,920 | $4,160 | $35,760 |
| 2013 | -- | $55,440 | $10,200 | $45,240 |
Source: Public Records
Map
Nearby Homes
- 664 Browning Ln SE
- 661 Browning Ln SE
- 1328 White Oak St SE
- 675 Hunting Creek Ln SE
- 1625 Old Salem Rd SE
- Evergreen Plan at Old Salem Crossing
- Crofton Plan at Old Salem Crossing
- Ivey Plan at Old Salem Crossing
- Holly Plan at Old Salem Crossing
- Linton Plan at Old Salem Crossing
- Hanover Plan at Old Salem Crossing
- Glen Plan at Old Salem Crossing
- Redland Plan at Old Salem Crossing
- 1509 Aralynn Ct Unit 1
- 1368 White Oak St SE Unit 2
- 1577 Salem Dr Unit 82
- 1581 Salem Dr Unit 80
- 1585 Salem Dr Unit 78
- 1575 Aiden Way Unit 38
- 1569 Aiden Way Unit 35
- 1189 Maple St SE
- 1193 Maple St SE
- 1661 Winchester Way SE
- 1663 Winchester Way SE Unit 6
- 1665 Winchester Way SE
- 1667 Winchester Way SE
- 1667 Winchester Way SE
- 1659 Winchester Way SE Unit 7
- 1669 Winchester Way SE
- 1671 Winchester Way SE Unit 1671
- 1673 Winchester Way SE
- 1651 Winchester Way SE
- 1675 Winchester Way SE
- 1195 Maple St SE
- 1677 Winchester Way SE
- 1192 Maple St SE
- 1192 Maple St SE Unit 14 & 15
- 1200 Maple St SE
- 1676 Winchester Way SE
- 1674 Winchester Way SE