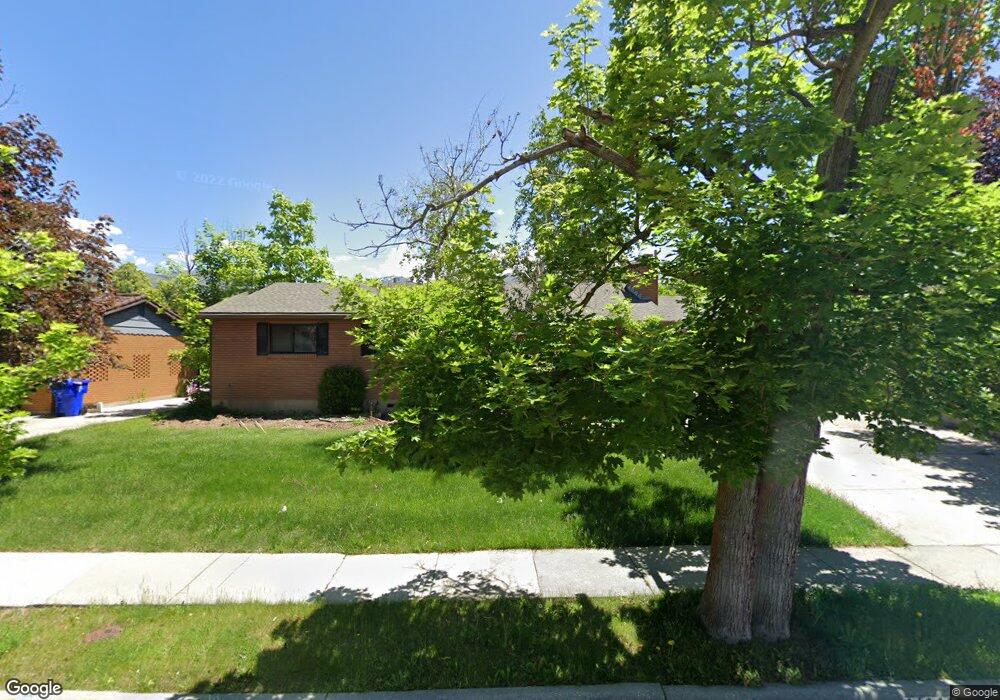
1191 S 350 W Bountiful, UT 84010
Estimated Value: $497,537 - $594,000
3
Beds
2
Baths
1,268
Sq Ft
$419/Sq Ft
Est. Value
About This Home
This home is located at 1191 S 350 W, Bountiful, UT 84010 and is currently estimated at $531,884, approximately $419 per square foot. 1191 S 350 W is a home located in Davis County with nearby schools including Bountiful Elementary School, Millcreek Junior High School, and Bountiful High School.
Ownership History
Date
Name
Owned For
Owner Type
Purchase Details
Closed on
Jan 16, 2018
Sold by
Thurston Kenneth A
Bought by
Young Whitney A
Current Estimated Value
Home Financials for this Owner
Home Financials are based on the most recent Mortgage that was taken out on this home.
Original Mortgage
$216,000
Outstanding Balance
$182,278
Interest Rate
3.94%
Mortgage Type
New Conventional
Estimated Equity
$349,606
Purchase Details
Closed on
Mar 27, 2001
Sold by
Valthurston Robert and Thurston Dawn G
Bought by
Thurston Robert and Thurston Dawn G
Create a Home Valuation Report for This Property
The Home Valuation Report is an in-depth analysis detailing your home's value as well as a comparison with similar homes in the area
Purchase History
| Date | Buyer | Sale Price | Title Company |
|---|---|---|---|
| Young Whitney A | -- | Cottonwood Title | |
| Thurston Robert | -- | -- |
Source: Public Records
Mortgage History
| Date | Status | Borrower | Loan Amount |
|---|---|---|---|
| Open | Young Whitney A | $216,000 |
Source: Public Records
Tax History
| Year | Tax Paid | Tax Assessment Tax Assessment Total Assessment is a certain percentage of the fair market value that is determined by local assessors to be the total taxable value of land and additions on the property. | Land | Improvement |
|---|---|---|---|---|
| 2025 | $2,872 | $261,800 | $124,909 | $136,891 |
| 2024 | $2,674 | $252,999 | $109,495 | $143,504 |
| 2023 | $2,564 | $440,000 | $203,447 | $236,553 |
| 2022 | $2,722 | $256,850 | $111,635 | $145,215 |
| 2021 | $2,475 | $357,000 | $146,014 | $210,986 |
| 2020 | $2,035 | $293,000 | $126,679 | $166,321 |
| 2019 | $2,068 | $291,000 | $137,246 | $153,754 |
| 2018 | $1,909 | $264,000 | $134,614 | $129,386 |
| 2016 | $1,629 | $121,880 | $54,817 | $67,063 |
| 2015 | $1,585 | $110,660 | $54,817 | $55,843 |
| 2014 | $1,628 | $118,632 | $54,817 | $63,815 |
| 2013 | -- | $103,434 | $36,190 | $67,244 |
Source: Public Records
Map
Nearby Homes
Your Personal Tour Guide
Ask me questions while you tour the home.