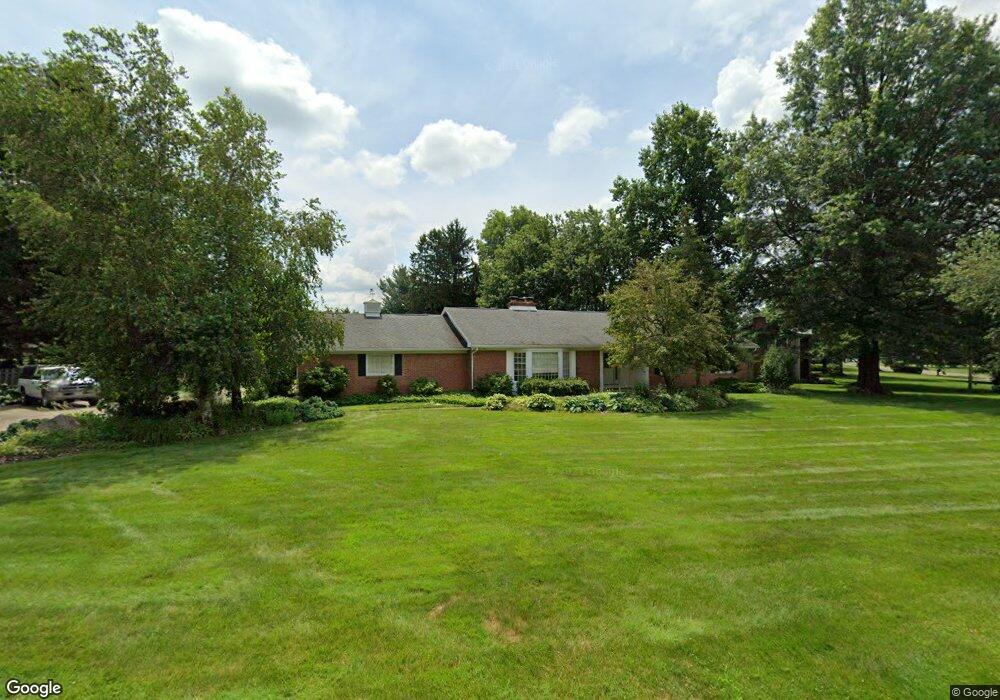
1191 Springbrook Dr Mansfield, OH 44906
Estimated Value: $344,000 - $372,000
3
Beds
4
Baths
2,630
Sq Ft
$137/Sq Ft
Est. Value
About This Home
This home is located at 1191 Springbrook Dr, Mansfield, OH 44906 and is currently estimated at $359,495, approximately $136 per square foot. 1191 Springbrook Dr is a home located in Richland County with nearby schools including Mansfield Christian School, Discovery School, and Mansfield Seventh-day Adventist School.
Ownership History
Date
Name
Owned For
Owner Type
Purchase Details
Closed on
Nov 4, 2020
Sold by
Groff Mary
Bought by
Groff Mary H and The Mary H Groff Family Trust
Current Estimated Value
Purchase Details
Closed on
Nov 30, 2018
Sold by
Boliantz John and Boliantz Monica
Bought by
Groff Mary
Purchase Details
Closed on
Apr 30, 2008
Sold by
Ritcher Albert R
Bought by
Boliantz John and Boliantz Monica
Purchase Details
Closed on
Sep 21, 2000
Sold by
Nelson Jones Trust
Bought by
Albert R & Audrey Ritcher Trustees
Purchase Details
Closed on
Jul 8, 1999
Sold by
Schmitt Joseph A
Bought by
Jones Nelson
Home Financials for this Owner
Home Financials are based on the most recent Mortgage that was taken out on this home.
Original Mortgage
$147,920
Interest Rate
6.89%
Mortgage Type
New Conventional
Purchase Details
Closed on
May 24, 1994
Sold by
Schmitt Joseph A
Bought by
Schmitt Joseph A
Purchase Details
Closed on
Feb 26, 1993
Sold by
Brook Avis M
Bought by
Schmitt Joseph A
Create a Home Valuation Report for This Property
The Home Valuation Report is an in-depth analysis detailing your home's value as well as a comparison with similar homes in the area
Home Values in the Area
Average Home Value in this Area
Purchase History
| Date | Buyer | Sale Price | Title Company |
|---|---|---|---|
| Groff Mary H | -- | None Available | |
| Groff Mary | $179,450 | Barrister Title Group | |
| Boliantz John | $167,500 | Southern Title | |
| Albert R & Audrey Ritcher Trustees | $190,000 | -- | |
| Jones Nelson | $184,900 | -- | |
| Schmitt Joseph A | -- | -- | |
| Schmitt Joseph A | $155,000 | -- |
Source: Public Records
Mortgage History
| Date | Status | Borrower | Loan Amount |
|---|---|---|---|
| Previous Owner | Jones Nelson | $147,920 |
Source: Public Records
Tax History
| Year | Tax Paid | Tax Assessment Tax Assessment Total Assessment is a certain percentage of the fair market value that is determined by local assessors to be the total taxable value of land and additions on the property. | Land | Improvement |
|---|---|---|---|---|
| 2024 | $4,091 | $89,300 | $15,720 | $73,580 |
| 2023 | $4,183 | $89,300 | $15,720 | $73,580 |
| 2022 | $3,839 | $68,670 | $13,930 | $54,740 |
| 2021 | $3,865 | $68,670 | $13,930 | $54,740 |
| 2020 | $3,953 | $68,670 | $13,930 | $54,740 |
| 2019 | $4,015 | $62,940 | $11,810 | $51,130 |
| 2018 | $3,960 | $62,940 | $11,810 | $51,130 |
| 2017 | $3,910 | $62,940 | $11,810 | $51,130 |
| 2016 | $3,967 | $62,820 | $11,450 | $51,370 |
| 2015 | $3,789 | $62,820 | $11,450 | $51,370 |
| 2014 | $3,740 | $62,820 | $11,450 | $51,370 |
| 2012 | $1,469 | $64,770 | $11,810 | $52,960 |
Source: Public Records
Map
Nearby Homes
- 1250 Rosedale Dr
- 210 Whippoorwill Ln
- 1326 Rosedale Dr
- 1314 Bridgewater Way N
- 1307 Bridgewater Way N Unit 1307
- 1327 S Trimble Rd
- 1560 Bridgewater Way N
- 1485 Overdale Dr
- 1480 Overdale Dr
- 1476 Overdale Dr
- 755 Locust Ln
- 1520 Bridgewater Way S Unit 1518
- 1576 Bridgewater Way S
- 893 Greenfield Dr
- 0 Lot #23132 Hess Cir
- 0 Lot #23127 Hess Cir
- 0 Lot #23139 Hess Cir
- 0 Lot #23121 Hess Cir
- 0 Lot #23133 Hess Cir
- 735 Courtwright Blvd
- 1217 Springbrook Dr
- 1200 Rosedale Dr
- 1212 Rosedale Dr
- 1180 Rosedale Dr
- 1182 Springbrook Dr
- 1192 Springbrook Dr
- 1227 Springbrook Dr
- 1202 Springbrook Dr
- 1212 Springbrook Dr
- 1170 Springbrook Dr
- 1224 Rosedale Dr
- 1222 Springbrook Dr
- 1233 Springbrook Dr
- 1158 Springbrook Dr
- 1230 Springbrook Dr
- 1236 Rosedale Dr
- 1345 Brookpark Dr
- 1181 W Cook Rd
- 1355 Brookpark Dr
- 1201 Rosedale Dr
Your Personal Tour Guide
Ask me questions while you tour the home.