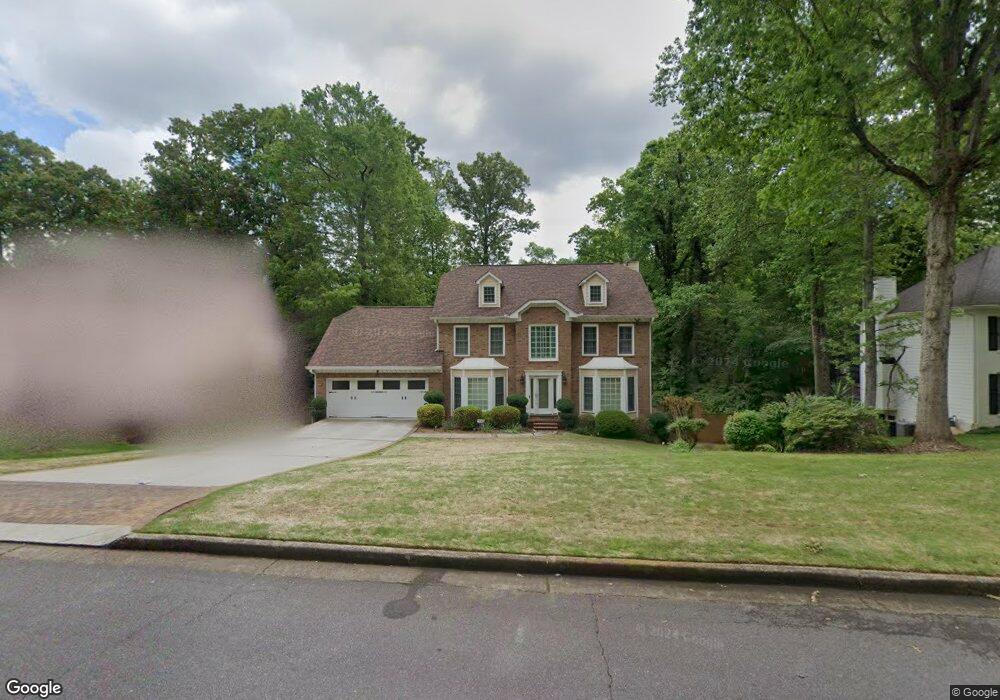
11910 N Hickory Trace Unit 1 Alpharetta, GA 30004
Estimated Value: $695,000 - $729,000
4
Beds
3
Baths
2,655
Sq Ft
$270/Sq Ft
Est. Value
About This Home
This home is located at 11910 N Hickory Trace Unit 1, Alpharetta, GA 30004 and is currently estimated at $716,116, approximately $269 per square foot. 11910 N Hickory Trace Unit 1 is a home located in Fulton County with nearby schools including Crabapple Crossing Elementary School, Northwestern Middle School, and Milton High School.
Ownership History
Date
Name
Owned For
Owner Type
Purchase Details
Closed on
May 31, 2022
Sold by
Baptiste John
Bought by
Baptiste John S and John S Baptiste Rev Liv Tr
Current Estimated Value
Purchase Details
Closed on
Oct 26, 1999
Sold by
Duncan Judith L
Bought by
Baptiste Lorraine A
Home Financials for this Owner
Home Financials are based on the most recent Mortgage that was taken out on this home.
Original Mortgage
$206,337
Interest Rate
7.76%
Mortgage Type
New Conventional
Purchase Details
Closed on
Dec 17, 1997
Sold by
Sonenberg Wm H and Sonenberg Harriett
Bought by
Duncan Judith L
Home Financials for this Owner
Home Financials are based on the most recent Mortgage that was taken out on this home.
Original Mortgage
$130,000
Interest Rate
7.26%
Mortgage Type
New Conventional
Create a Home Valuation Report for This Property
The Home Valuation Report is an in-depth analysis detailing your home's value as well as a comparison with similar homes in the area
Home Values in the Area
Average Home Value in this Area
Purchase History
| Date | Buyer | Sale Price | Title Company |
|---|---|---|---|
| Baptiste John S | -- | -- | |
| Baptiste Lorraine A | $242,800 | -- | |
| Duncan Judith L | $217,000 | -- |
Source: Public Records
Mortgage History
| Date | Status | Borrower | Loan Amount |
|---|---|---|---|
| Previous Owner | Baptiste Lorraine A | $206,337 | |
| Previous Owner | Duncan Judith L | $130,000 |
Source: Public Records
Tax History Compared to Growth
Tax History
| Year | Tax Paid | Tax Assessment Tax Assessment Total Assessment is a certain percentage of the fair market value that is determined by local assessors to be the total taxable value of land and additions on the property. | Land | Improvement |
|---|---|---|---|---|
| 2025 | $1,489 | $241,280 | $47,280 | $194,000 |
| 2023 | $6,707 | $237,600 | $60,440 | $177,160 |
| 2022 | $3,060 | $196,640 | $71,960 | $124,680 |
| 2021 | $3,566 | $156,240 | $56,360 | $99,880 |
| 2020 | $3,576 | $147,680 | $30,400 | $117,280 |
| 2019 | $530 | $145,080 | $29,880 | $115,200 |
| 2018 | $3,366 | $141,680 | $29,160 | $112,520 |
| 2017 | $3,000 | $117,000 | $28,360 | $88,640 |
| 2016 | $2,984 | $117,000 | $28,360 | $88,640 |
| 2015 | $3,467 | $117,000 | $28,360 | $88,640 |
| 2014 | $2,480 | $93,640 | $22,720 | $70,920 |
Source: Public Records
Map
Nearby Homes
- 11925 Stradford Wood
- 160 Watermill Falls
- 755 Anna Ln
- 200 Welford Trace
- 1010 Blue Indigo Dr
- 910 Reece Rd
- 12250 Broadwell Rd
- 165 Foe Creek Ct
- 5065 Jonquilla Dr
- 12350 Charlotte Dr
- 775 Upper Hembree Rd
- 1020 Cathedral Dr
- 1110 Upper Hembree Rd
- 145 Pruitt Dr
- 1270 Taylor Oaks Dr
- 7411 Mid Broadwell Trace
- 12455 Broadwell Rd Unit 201
- 12455 Broadwell Rd Unit 202
- 1080 Taylor Oaks Dr
- 11920 N Hickory Trace Unit 1
- 11860 Old Station Place
- 11860 Old Station Place Unit 6
- 11890 N Hickory Trace Unit 1
- 11870 Old Station Place
- 11870 Old Station Place Unit 7
- 110 N Bluff
- 11975 N Hickory Trace
- 11985 N Hickory Trace
- N N Hickory Trace
- 11965 N Hickory Trace Unit 1
- 11850 Old Station Place
- 11850 Old Station Place Unit 7
- 11880 N Hickory Trace
- 11995 N Hickory Trace Unit 1
- 11880 Old Station Place
- 115 N Bluff
- 0 North Bluff
- 120 N Bluff
- 115 North Bluff