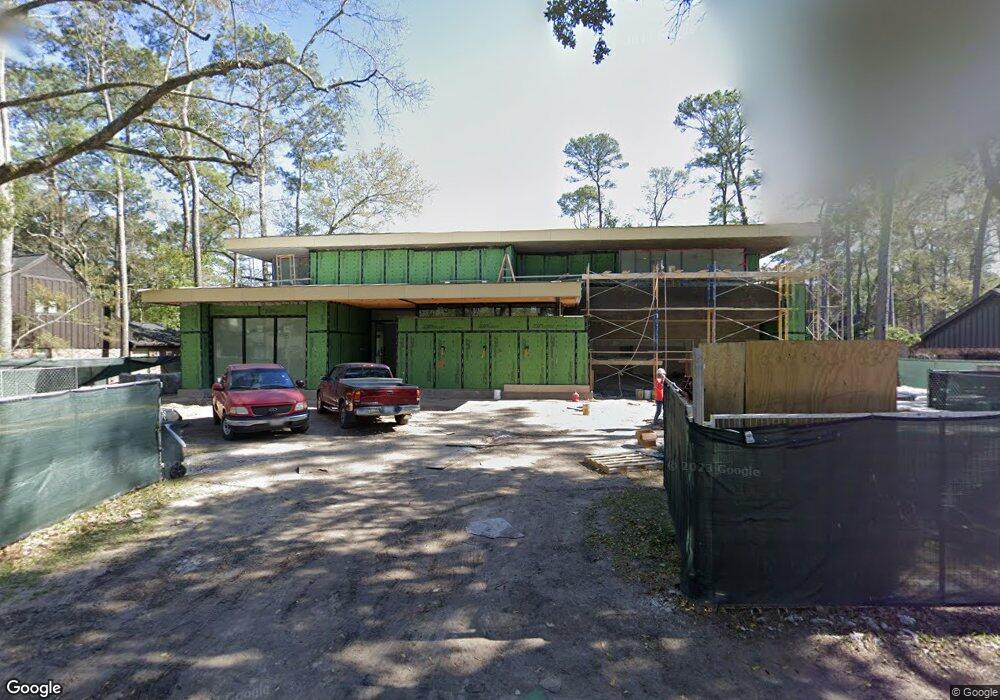
11911 S Durrette Dr Houston, TX 77024
Memorial NeighborhoodEstimated Value: $1,735,000 - $3,961,693
4
Beds
4
Baths
2,822
Sq Ft
$1,080/Sq Ft
Est. Value
About This Home
This home is located at 11911 S Durrette Dr, Houston, TX 77024 and is currently estimated at $3,048,564, approximately $1,080 per square foot. 11911 S Durrette Dr is a home located in Harris County with nearby schools including Frostwood Elementary School, Memorial Middle, and Memorial High School.
Ownership History
Date
Name
Owned For
Owner Type
Purchase Details
Closed on
Aug 7, 2017
Sold by
Ejc Cpiatl Llc
Bought by
Chong Eugene J
Current Estimated Value
Purchase Details
Closed on
Dec 21, 2013
Sold by
Chong Eugene J
Bought by
Ejc Capital Llc
Purchase Details
Closed on
Aug 19, 2013
Sold by
Cannon John G and Cannon Ellen W
Bought by
Chong Eugene Jinho
Purchase Details
Closed on
Nov 3, 1999
Sold by
Cannon Alexis M
Bought by
Cannon John G
Home Financials for this Owner
Home Financials are based on the most recent Mortgage that was taken out on this home.
Original Mortgage
$203,000
Interest Rate
7.77%
Mortgage Type
Seller Take Back
Purchase Details
Closed on
Jun 20, 1994
Sold by
Foulds Duncan Kilgour
Bought by
Cannon John G and Cannon Alexis M
Home Financials for this Owner
Home Financials are based on the most recent Mortgage that was taken out on this home.
Original Mortgage
$250,000
Interest Rate
8.49%
Create a Home Valuation Report for This Property
The Home Valuation Report is an in-depth analysis detailing your home's value as well as a comparison with similar homes in the area
Home Values in the Area
Average Home Value in this Area
Purchase History
| Date | Buyer | Sale Price | Title Company |
|---|---|---|---|
| Chong Eugene J | -- | None Available | |
| Ejc Capital Llc | -- | None Available | |
| Chong Eugene Jinho | -- | Stewart Title | |
| Cannon John G | -- | -- | |
| Cannon John G | -- | Regency Title |
Source: Public Records
Mortgage History
| Date | Status | Borrower | Loan Amount |
|---|---|---|---|
| Previous Owner | Cannon John G | $203,000 | |
| Previous Owner | Cannon John G | $250,000 |
Source: Public Records
Tax History Compared to Growth
Tax History
| Year | Tax Paid | Tax Assessment Tax Assessment Total Assessment is a certain percentage of the fair market value that is determined by local assessors to be the total taxable value of land and additions on the property. | Land | Improvement |
|---|---|---|---|---|
| 2025 | $60,251 | $3,746,449 | $1,278,760 | $2,467,689 |
| 2024 | $60,251 | $3,050,000 | $1,198,838 | $1,851,162 |
| 2023 | $60,251 | $3,477,748 | $1,118,915 | $2,358,833 |
| 2022 | $50,194 | $2,146,938 | $1,118,915 | $1,028,023 |
| 2021 | $27,356 | $1,120,470 | $1,118,915 | $1,555 |
| 2020 | $28,208 | $1,125,815 | $1,118,915 | $6,900 |
| 2019 | $28,611 | $1,092,880 | $1,015,795 | $77,085 |
| 2018 | $10,335 | $1,055,942 | $978,857 | $77,085 |
| 2017 | $31,289 | $1,196,000 | $1,118,915 | $77,085 |
| 2016 | $32,701 | $1,250,000 | $1,118,915 | $131,085 |
| 2015 | $28,740 | $1,065,000 | $895,132 | $169,868 |
| 2014 | $28,740 | $1,079,800 | $895,132 | $184,668 |
Source: Public Records
Map
Nearby Homes
- 318 Knipp Rd
- 345 Knipp Rd
- 11722 Claywood St
- 234 Plantation Rd
- 31 Knipp Rd
- 6 Gessner Rd
- 45 Patti Lynn Ln
- 170 Haversham Dr
- 11711 Memorial Dr Unit 570
- 11711 Memorial Dr Unit 55
- 11711 Memorial Dr Unit 21
- 11711 Memorial Dr Unit 565
- 11711 Memorial Dr Unit 695
- 11711 Memorial Dr Unit 644
- 11711 Memorial Dr Unit 285
- 11711 Memorial Dr Unit 371
- 11711 Memorial Dr Unit 129
- 11711 Memorial Dr Unit 251
- 11711 Memorial Dr Unit 573
- 11711 Memorial Dr Unit 545
- 11905 S Durrette Dr
- 11923 S Durrette Dr
- 11904 Wink Rd
- 11910 Wink Rd
- 11929 S Durrette Dr
- 11914 N Durrette Dr
- 11902 N Durrette Dr
- 11916 Wink Rd
- 11850 Wink Rd
- 11920 N Durrette Dr
- 11924 S Durrette Dr
- 11903 Wink Rd
- 11935 S Durrette Dr
- 11909 Wink Rd
- 11851 Durrette Dr
- 11911 Wink Rd
- 11922 Wink Rd
- 11907 Memorial Dr
- 11901 Memorial Dr
- 11913 Memorial Dr