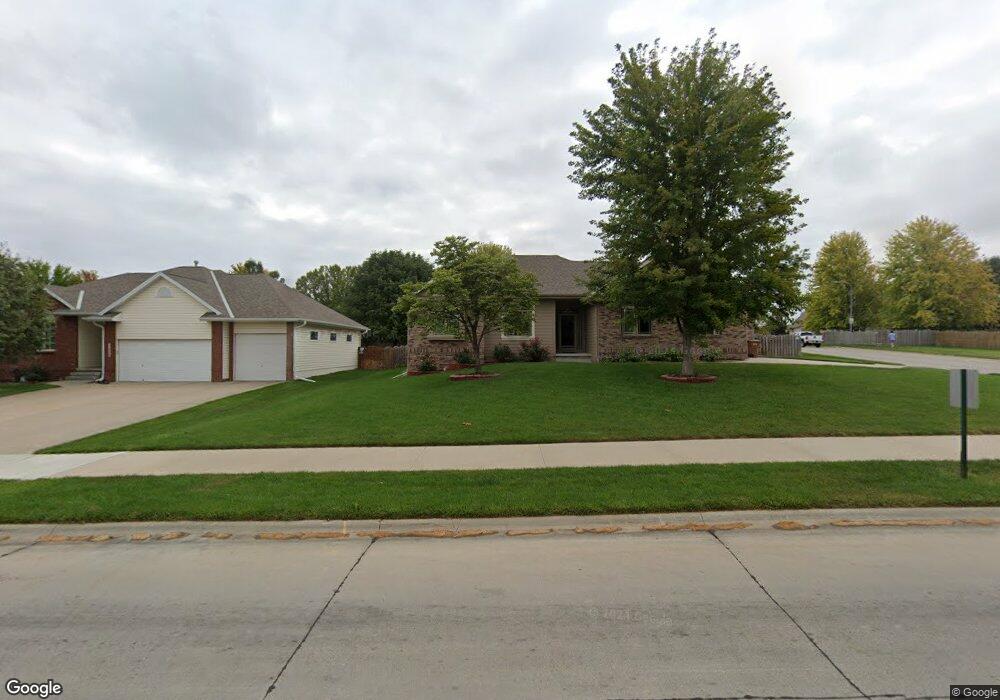
11911 Timberridge Dr Papillion, NE 68133
Estimated Value: $438,044 - $570,000
4
Beds
3
Baths
2,345
Sq Ft
$206/Sq Ft
Est. Value
About This Home
This home is located at 11911 Timberridge Dr, Papillion, NE 68133 and is currently estimated at $482,761, approximately $205 per square foot. 11911 Timberridge Dr is a home located in Sarpy County with nearby schools including Bellevue Elementary School, Lewis & Clark Middle School, and Bellevue West High School.
Ownership History
Date
Name
Owned For
Owner Type
Purchase Details
Closed on
Jul 30, 2009
Sold by
Belt Construction Inc
Bought by
Laughlin Francis M and Laughlin Carol A
Current Estimated Value
Home Financials for this Owner
Home Financials are based on the most recent Mortgage that was taken out on this home.
Original Mortgage
$234,896
Interest Rate
5.41%
Purchase Details
Closed on
Apr 2, 2009
Sold by
Laughlin Frank and Laughlin Carol
Bought by
Belt Construction Inc
Purchase Details
Closed on
Feb 6, 2009
Sold by
Arcosanti Homes Inc
Bought by
Laughlin Frank and Laughlin Carol
Purchase Details
Closed on
Aug 26, 2004
Sold by
Dodge Lots Joint Venture
Bought by
Arcosanti Homes Inc
Create a Home Valuation Report for This Property
The Home Valuation Report is an in-depth analysis detailing your home's value as well as a comparison with similar homes in the area
Home Values in the Area
Average Home Value in this Area
Purchase History
| Date | Buyer | Sale Price | Title Company |
|---|---|---|---|
| Laughlin Francis M | $294,000 | Clean Title & Escrow Llc | |
| Belt Construction Inc | $32,000 | Cte | |
| Laughlin Frank | $44,000 | Sarpy Title Services Inc | |
| Arcosanti Homes Inc | $34,000 | -- |
Source: Public Records
Mortgage History
| Date | Status | Borrower | Loan Amount |
|---|---|---|---|
| Closed | Laughlin Francis M | $234,896 |
Source: Public Records
Tax History Compared to Growth
Tax History
| Year | Tax Paid | Tax Assessment Tax Assessment Total Assessment is a certain percentage of the fair market value that is determined by local assessors to be the total taxable value of land and additions on the property. | Land | Improvement |
|---|---|---|---|---|
| 2025 | $6,818 | $415,868 | $58,000 | $357,868 |
| 2024 | $7,582 | $390,836 | $58,000 | $332,836 |
| 2023 | $7,582 | $359,044 | $53,000 | $306,044 |
| 2022 | $6,946 | $322,770 | $50,000 | $272,770 |
| 2021 | $6,844 | $312,661 | $50,000 | $262,661 |
| 2020 | $6,618 | $301,119 | $42,000 | $259,119 |
| 2019 | $6,564 | $290,970 | $38,000 | $252,970 |
| 2018 | $6,520 | $291,549 | $38,000 | $253,549 |
| 2017 | $6,474 | $281,180 | $38,000 | $243,180 |
| 2016 | $6,248 | $272,303 | $36,000 | $236,303 |
| 2015 | $6,013 | $262,370 | $36,000 | $226,370 |
| 2014 | $6,042 | $252,725 | $36,000 | $216,725 |
| 2012 | -- | $250,320 | $36,000 | $214,320 |
Source: Public Records
Map
Nearby Homes
- 11903 S 49th St
- 11828 S 52nd St
- 4724 Coffey St
- 4714 Coffey St
- 5004 Westlake Cir
- 4556 Barksdale Dr
- 4557 Barksdale Dr
- 4552 Barksdale Dr
- 5008 Westlake Cir
- 4614 Windcrest Dr
- 4510 Barksdale Dr
- 12039 S 45th Ave
- 5114 Timberridge Dr
- 12017 Daniell Rd
- 4406 Barksdale Dr
- 12029 Daniell Rd
- 12033 Daniell Rd
- 12037 Daniell Rd
- 12105 Daniell Rd
- 12109 Daniell Rd
- 11909 Timberridge Dr
- 11912 S 49th St
- 11914 S 49th St
- 11913 Timberridge Dr
- 11907 Timberridge Dr
- 11910 S 49th St
- 12004 S 49th St
- 11912 Timberridge Dr
- 11910 Timberridge Dr
- 11905 Timberridge Dr
- 11914 Timberridge Dr
- 11908 S 49th St
- 11915 Timberridge Dr
- 12006 S 49th St
- 11908 Timberridge Dr
- 11916 Timberridge Dr
- 12008 S 49th St
- 11906 Timberridge Dr
- 11906 S 49th St
- 11917 Timberridge Dr