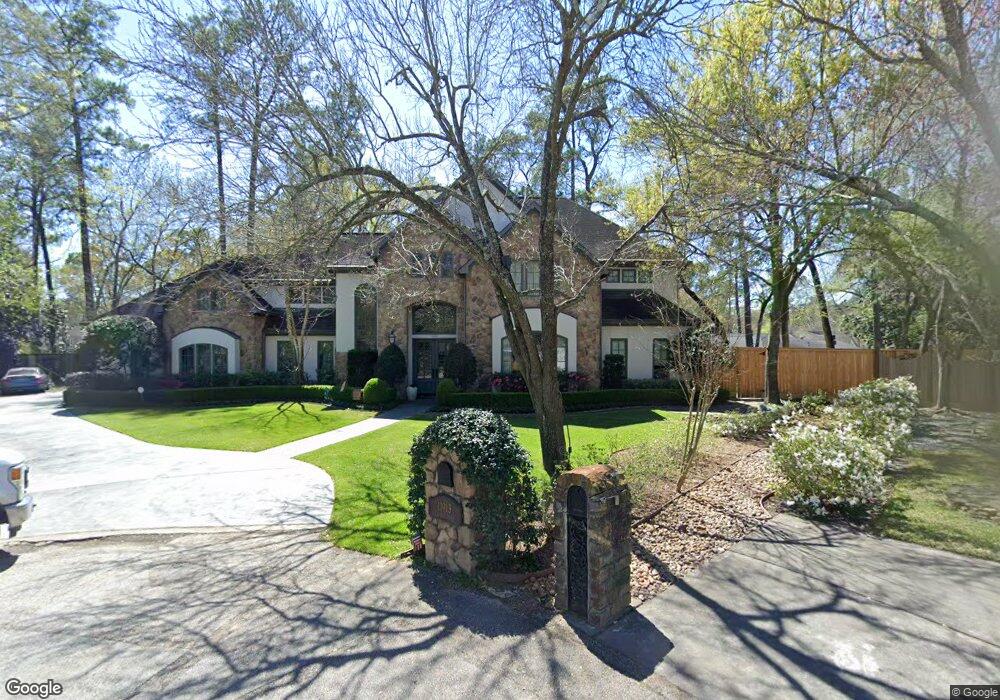
11913 Laurie Ln Houston, TX 77024
Estimated Value: $3,075,000 - $3,487,393
5
Beds
7
Baths
6,117
Sq Ft
$546/Sq Ft
Est. Value
About This Home
This home is located at 11913 Laurie Ln, Houston, TX 77024 and is currently estimated at $3,339,464, approximately $545 per square foot. 11913 Laurie Ln is a home located in Harris County with nearby schools including Bunker Hill Elementary School, Memorial Middle, and Memorial High School.
Ownership History
Date
Name
Owned For
Owner Type
Purchase Details
Closed on
Feb 11, 2015
Sold by
Curry Michael J and Curry Shelley G
Bought by
Curry Michael J and Curry Shelley G
Current Estimated Value
Purchase Details
Closed on
Jul 31, 2008
Sold by
Crawford Tamara and Crawford Benjamin H
Bought by
Curry Michael J and Curry Shelley G
Home Financials for this Owner
Home Financials are based on the most recent Mortgage that was taken out on this home.
Original Mortgage
$1,575,000
Interest Rate
5.5%
Mortgage Type
Purchase Money Mortgage
Purchase Details
Closed on
May 19, 2004
Sold by
Houdek Thomas Dale
Bought by
Crawford Tamara
Home Financials for this Owner
Home Financials are based on the most recent Mortgage that was taken out on this home.
Original Mortgage
$460,000
Interest Rate
5.62%
Mortgage Type
Purchase Money Mortgage
Purchase Details
Closed on
Feb 18, 2000
Sold by
Lyon James R
Bought by
Lyon Phyllis Jeanne
Create a Home Valuation Report for This Property
The Home Valuation Report is an in-depth analysis detailing your home's value as well as a comparison with similar homes in the area
Home Values in the Area
Average Home Value in this Area
Purchase History
| Date | Buyer | Sale Price | Title Company |
|---|---|---|---|
| Curry Michael J | -- | None Available | |
| Curry Michael J | -- | Etc | |
| Crawford Tamara | -- | Chicago Title | |
| Lyon Phyllis Jeanne | -- | -- |
Source: Public Records
Mortgage History
| Date | Status | Borrower | Loan Amount |
|---|---|---|---|
| Previous Owner | Curry Michael J | $1,575,000 | |
| Previous Owner | Crawford Tamara | $460,000 | |
| Closed | Crawford Tamara | $57,500 |
Source: Public Records
Tax History Compared to Growth
Tax History
| Year | Tax Paid | Tax Assessment Tax Assessment Total Assessment is a certain percentage of the fair market value that is determined by local assessors to be the total taxable value of land and additions on the property. | Land | Improvement |
|---|---|---|---|---|
| 2025 | $39,902 | $3,072,816 | $1,251,000 | $1,821,816 |
| 2024 | $39,902 | $2,531,005 | $1,209,300 | $1,321,705 |
| 2023 | $39,902 | $2,570,632 | $1,146,750 | $1,423,882 |
| 2022 | $49,888 | $2,399,268 | $1,146,750 | $1,252,518 |
| 2021 | $52,481 | $2,423,359 | $1,084,200 | $1,339,159 |
| 2020 | $52,309 | $2,361,917 | $1,084,200 | $1,277,717 |
| 2019 | $61,232 | $2,654,572 | $1,084,200 | $1,570,372 |
| 2018 | $12,644 | $2,488,400 | $1,084,200 | $1,404,200 |
| 2017 | $58,555 | $2,538,500 | $1,084,200 | $1,454,300 |
| 2016 | $56,185 | $2,576,500 | $1,084,200 | $1,492,300 |
| 2015 | $38,184 | $2,744,914 | $1,084,200 | $1,660,714 |
| 2014 | $38,184 | $2,399,772 | $938,250 | $1,461,522 |
Source: Public Records
Map
Nearby Homes
- 12003 Tall Oaks St
- 345 Knipp Rd
- 11910 Heritage Ln
- 601 Strey Ln
- 318 Knipp Rd
- 234 Plantation Rd
- 11718 Broken Bough Cir
- 12334 Beauregard Dr
- 170 Haversham Dr
- 11640 Greenbay St
- 711 Timber Hill Dr
- 12222 Broken Bough Dr
- 0 Gessner Rd
- 150 Gessner Rd Unit 5A
- 12327 Tunbridge Ln
- 11722 Claywood St
- 517 Flintdale Rd
- 12326 Old Oaks Dr
- 358 Tealwood Dr
- 354 Tealwood Dr
- 11914 Laurie Ln
- 11922 Winwood Ln
- 11911 Laurie Ln
- 11923 Surrey Ln
- 355 Knipp Rd
- 11910 Laurie Ln
- 11922 Musket Ln
- 11923 Winwood Ln
- 11911 Mcleods Ln
- 11926 Winwood Ln
- 11907 Laurie Ln
- 11927 Surrey Ln
- 407 Godsey Ct
- 11906 Laurie Ln
- 11922 Surrey Ln
- 11927 Winwood Ln
- 11907 Mcleods Ln
- 403 Godsey Ct
- 11910 Mcleods Ln
- 11926 Surrey Ln