Estimated Value: $362,795 - $399,000
4
Beds
3
Baths
2,900
Sq Ft
$133/Sq Ft
Est. Value
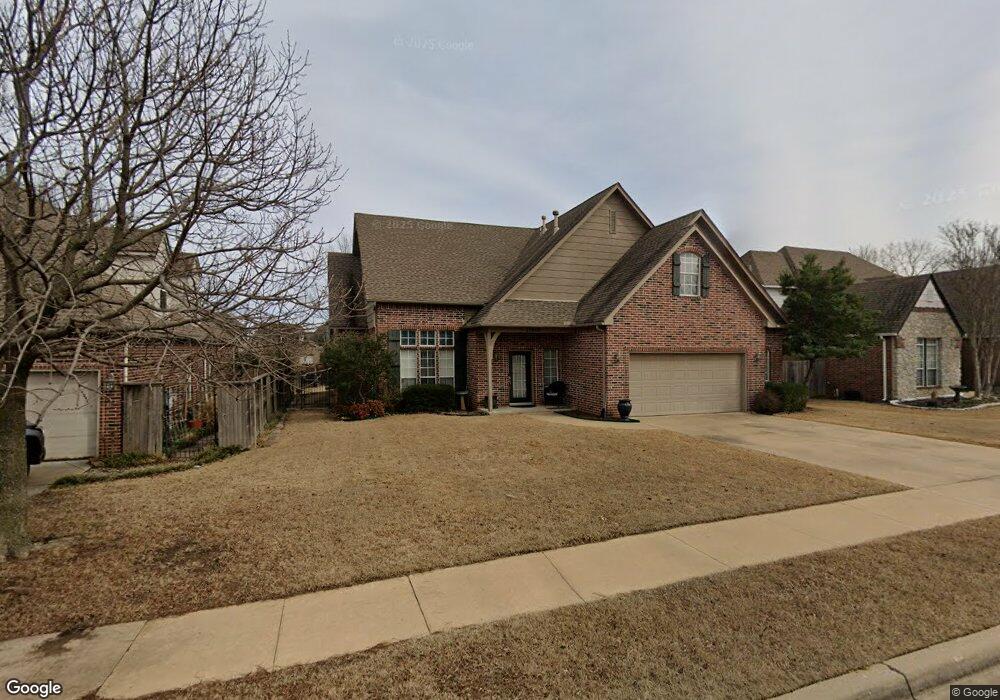
About This Home
This home is located at 11915 S Date Ave, Jenks, OK 74037 and is currently estimated at $385,449, approximately $132 per square foot. 11915 S Date Ave is a home located in Tulsa County with nearby schools including Jenks West Elementary School, Jenks West Intermediate Elementary School, and Jenks Middle School.
Ownership History
Date
Name
Owned For
Owner Type
Purchase Details
Closed on
May 7, 2020
Sold by
Estep Rodger S and Estep Cheryl A
Bought by
Estep Rodger S and Estep Cheryl A
Current Estimated Value
Purchase Details
Closed on
Aug 17, 2000
Sold by
Hearthstone Properties Inc
Bought by
Estep Rodger S and Estep Cheryl A
Home Financials for this Owner
Home Financials are based on the most recent Mortgage that was taken out on this home.
Original Mortgage
$127,000
Outstanding Balance
$46,049
Interest Rate
8.22%
Mortgage Type
Purchase Money Mortgage
Estimated Equity
$339,400
Purchase Details
Closed on
Mar 17, 2000
Sold by
Peoria Development Co Llc
Bought by
Hearthstone Properties Inc
Home Financials for this Owner
Home Financials are based on the most recent Mortgage that was taken out on this home.
Original Mortgage
$159,200
Interest Rate
8.23%
Mortgage Type
Purchase Money Mortgage
Create a Home Valuation Report for This Property
The Home Valuation Report is an in-depth analysis detailing your home's value as well as a comparison with similar homes in the area
Home Values in the Area
Average Home Value in this Area
Purchase History
| Date | Buyer | Sale Price | Title Company |
|---|---|---|---|
| Estep Rodger S | -- | None Available | |
| Estep Rodger S | $187,000 | Delta Title & Escrow | |
| Hearthstone Properties Inc | $30,000 | -- |
Source: Public Records
Mortgage History
| Date | Status | Borrower | Loan Amount |
|---|---|---|---|
| Open | Estep Rodger S | $127,000 | |
| Previous Owner | Hearthstone Properties Inc | $159,200 |
Source: Public Records
Tax History Compared to Growth
Tax History
| Year | Tax Paid | Tax Assessment Tax Assessment Total Assessment is a certain percentage of the fair market value that is determined by local assessors to be the total taxable value of land and additions on the property. | Land | Improvement |
|---|---|---|---|---|
| 2024 | $3,113 | $25,216 | $2,312 | $22,904 |
| 2023 | $3,113 | $25,453 | $2,556 | $22,897 |
| 2022 | $3,048 | $23,711 | $3,261 | $20,450 |
| 2021 | $2,994 | $22,991 | $3,162 | $19,829 |
| 2020 | $2,928 | $22,991 | $3,162 | $19,829 |
| 2019 | $2,948 | $22,991 | $3,162 | $19,829 |
| 2018 | $2,959 | $22,925 | $3,099 | $19,826 |
| 2017 | $2,911 | $23,925 | $3,234 | $20,691 |
| 2016 | $2,983 | $23,925 | $3,234 | $20,691 |
| 2015 | $3,039 | $23,925 | $3,234 | $20,691 |
| 2014 | $3,108 | $23,925 | $3,234 | $20,691 |
Source: Public Records
Map
Nearby Homes
- 11920 S Cedar Ave
- 12120 S Elm St
- 12102 S Elm St
- 320 W 130th Place S
- 626 W 120th St S
- 12209 S Ash Ave
- 11920 S Holley St
- 11220 S Fir Ave
- 11212 S Fir Ave
- 107 E 116th Place
- 11471 S Ash St
- 322 W 126th St S
- 187 E 116th St
- 12534 S 1st St
- 124 W 126th St S
- 1734 W 115th Place
- 318 W 127th St S
- 11427 S Ash St
- 682 W 113th Ct S
- 205 E 116th St
- 11911 S Date Ave
- 11919 S Date Ave
- 11923 S Date Ave
- 11907 S Date Ave
- 11912 S Cedar Ave
- 11904 S Cedar Ave
- 11918 S Date Ave
- 11914 S Date Ave
- 11908 S Cedar Ave
- 11922 S Date Ave
- 11910 S Date Ave
- 11916 S Cedar Ave
- 12011 S Date Ave
- 11900 S Cedar Ave
- 11903 S Date Ave
- 11906 S Date Ave
- 12015 S Date Ave
- 11414 S Date Ave
- 11905 S Cedar Ave
- 11909 S Cedar Ave