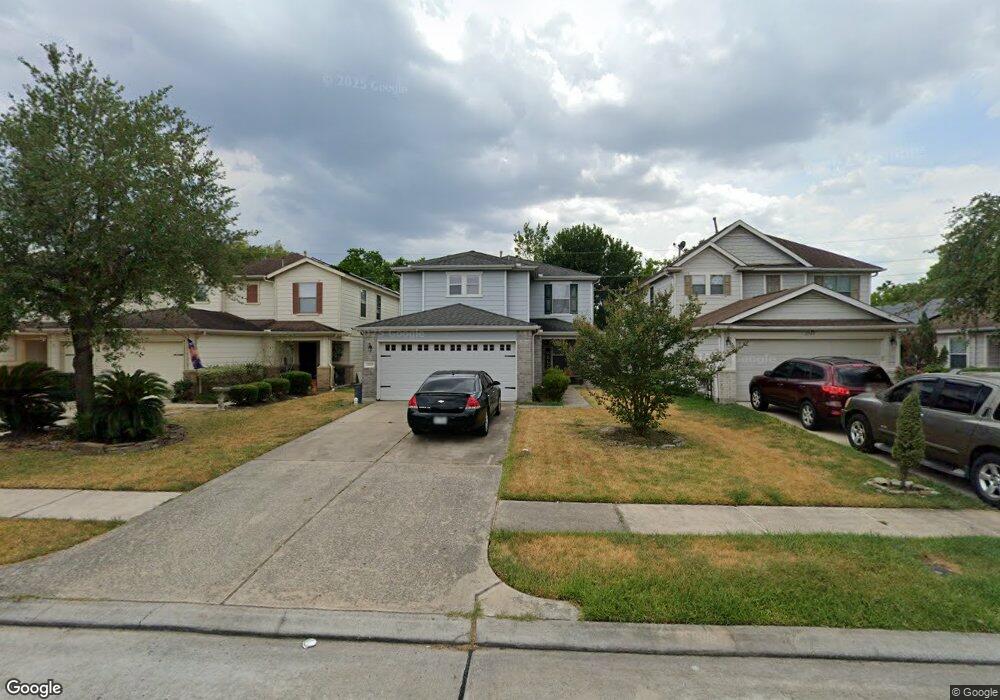
11919 Madison Oak St Houston, TX 77038
North Houston NeighborhoodEstimated Value: $256,000 - $270,000
3
Beds
2
Baths
2,222
Sq Ft
$119/Sq Ft
Est. Value
About This Home
This home is located at 11919 Madison Oak St, Houston, TX 77038 and is currently estimated at $263,321, approximately $118 per square foot. 11919 Madison Oak St is a home located in Harris County with nearby schools including Kujawa EC/Pre-K/K School, Carter Academy, and Shotwell Middle School.
Ownership History
Date
Name
Owned For
Owner Type
Purchase Details
Closed on
May 4, 2010
Sold by
Secretary Of Housing & Urban Development
Bought by
Henderson Chekesha
Current Estimated Value
Home Financials for this Owner
Home Financials are based on the most recent Mortgage that was taken out on this home.
Original Mortgage
$86,385
Outstanding Balance
$58,465
Interest Rate
5.25%
Mortgage Type
FHA
Estimated Equity
$204,856
Purchase Details
Closed on
Dec 8, 2009
Sold by
Bac Home Loans Servicing Lp
Bought by
The Secretary Of Housing & Urban Develop
Purchase Details
Closed on
Dec 1, 2009
Sold by
Norman Frederick S
Bought by
Bac Home Loans Servicing Lp and Countrywide Home Loans Servicing Lp
Purchase Details
Closed on
Aug 1, 2006
Sold by
Kb Home Lone Star Lp
Bought by
Norman Frederick S
Home Financials for this Owner
Home Financials are based on the most recent Mortgage that was taken out on this home.
Original Mortgage
$129,154
Interest Rate
6.78%
Mortgage Type
FHA
Create a Home Valuation Report for This Property
The Home Valuation Report is an in-depth analysis detailing your home's value as well as a comparison with similar homes in the area
Home Values in the Area
Average Home Value in this Area
Purchase History
| Date | Buyer | Sale Price | Title Company |
|---|---|---|---|
| Henderson Chekesha | -- | Etc | |
| The Secretary Of Housing & Urban Develop | -- | None Available | |
| Bac Home Loans Servicing Lp | $140,766 | None Available | |
| Norman Frederick S | -- | First American Title |
Source: Public Records
Mortgage History
| Date | Status | Borrower | Loan Amount |
|---|---|---|---|
| Open | Henderson Chekesha | $86,385 | |
| Previous Owner | Norman Frederick S | $129,154 |
Source: Public Records
Tax History Compared to Growth
Tax History
| Year | Tax Paid | Tax Assessment Tax Assessment Total Assessment is a certain percentage of the fair market value that is determined by local assessors to be the total taxable value of land and additions on the property. | Land | Improvement |
|---|---|---|---|---|
| 2025 | $6,107 | $261,258 | $44,035 | $217,223 |
| 2024 | $6,107 | $261,258 | $44,035 | $217,223 |
| 2023 | $6,107 | $262,370 | $44,035 | $218,335 |
| 2022 | $6,747 | $231,762 | $26,688 | $205,074 |
| 2021 | $6,372 | $194,061 | $26,688 | $167,373 |
| 2020 | $5,987 | $176,874 | $26,688 | $150,186 |
| 2019 | $5,606 | $163,097 | $20,016 | $143,081 |
| 2018 | $1,630 | $154,161 | $20,016 | $134,145 |
| 2017 | $4,492 | $154,161 | $20,016 | $134,145 |
| 2016 | $4,083 | $134,746 | $20,016 | $114,730 |
| 2015 | $3,022 | $134,746 | $20,016 | $114,730 |
| 2014 | $3,022 | $103,099 | $20,016 | $83,083 |
Source: Public Records
Map
Nearby Homes
- 2934 Valiant Scene Ct
- 12026 Madison Oak St
- 12006 Mallard Stream Ct
- 2907 Valiant Scene Ct
- 12015 Audubon Hill Ct
- 12042 Mallard Stream Ct
- 12007 Bach Orchard Trail
- 11707 Madison Oak St
- 2746 Piney Lake Ct
- 2743 Oriole Wood Ct
- 2702 Urban Glen Ct
- 11623 Quinn Ridge Way
- 11726 Wren Crossing Dr
- 11727 State Highway 249
- 11638 Township Dale Ct
- 10809 W Montgomery Rd
- 2631 Palmetto Valley Dr
- 2606 Oakwood Bluff Trail
- 2615 Palmetto Valley Dr
- 2610 Cabin Cove Ln
- 11915 Madison Oak St
- 11923 Madison Oak St
- 11911 Madison Oak St
- 2951 Valiant Scene Ct
- 11927 Madison Oak St
- 11907 Madison Oak St
- 2950 Yearling Colt Ct
- 11931 Madison Oak St
- 2947 Valiant Scene Ct
- 11903 Madison Oak St
- 2946 Yearling Colt Ct
- 11935 Madison Oak St
- 2943 Valiant Scene Ct
- 11839 Madison Oak St
- 2942 Yearling Colt Ct
- 11939 Madison Oak St
- 2939 Valiant Scene Ct
- 2950 Valiant Scene Ct
- 11835 Madison Oak St
- 2938 Yearling Colt Ct