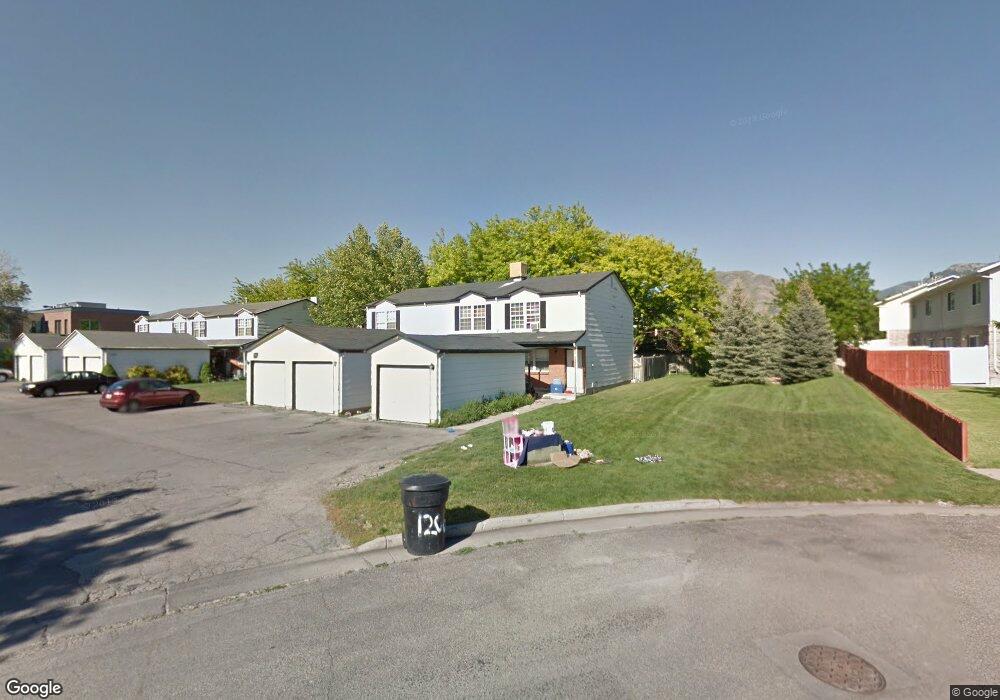
1192 N 120 W Logan, UT 84341
Bridger NeighborhoodEstimated Value: $253,649 - $299,000
2
Beds
2
Baths
1,116
Sq Ft
$239/Sq Ft
Est. Value
About This Home
This home is located at 1192 N 120 W, Logan, UT 84341 and is currently estimated at $266,662, approximately $238 per square foot. 1192 N 120 W is a home located in Cache County with nearby schools including Bridger School, Mount Logan Middle School, and Logan High School.
Ownership History
Date
Name
Owned For
Owner Type
Purchase Details
Closed on
Dec 16, 2024
Sold by
Anhder Cody
Bought by
Flying A Investments Llc
Current Estimated Value
Purchase Details
Closed on
Jan 19, 2022
Sold by
Quentin Casperson
Bought by
Anhder Cody
Home Financials for this Owner
Home Financials are based on the most recent Mortgage that was taken out on this home.
Original Mortgage
$183,375
Interest Rate
3.11%
Mortgage Type
New Conventional
Purchase Details
Closed on
Apr 29, 2006
Sold by
Blonquist Denise L and Blonquist Blair E
Bought by
Casperson Quentin
Home Financials for this Owner
Home Financials are based on the most recent Mortgage that was taken out on this home.
Original Mortgage
$52,500
Interest Rate
6.29%
Mortgage Type
New Conventional
Create a Home Valuation Report for This Property
The Home Valuation Report is an in-depth analysis detailing your home's value as well as a comparison with similar homes in the area
Home Values in the Area
Average Home Value in this Area
Purchase History
| Date | Buyer | Sale Price | Title Company |
|---|---|---|---|
| Flying A Investments Llc | -- | None Listed On Document | |
| Flying A Investments Llc | -- | None Listed On Document | |
| Anhder Cody | -- | None Listed On Document | |
| Casperson Quentin | -- | Northern Title Company |
Source: Public Records
Mortgage History
| Date | Status | Borrower | Loan Amount |
|---|---|---|---|
| Previous Owner | Anhder Cody | $183,375 | |
| Previous Owner | Casperson Quentin | $52,500 |
Source: Public Records
Tax History Compared to Growth
Tax History
| Year | Tax Paid | Tax Assessment Tax Assessment Total Assessment is a certain percentage of the fair market value that is determined by local assessors to be the total taxable value of land and additions on the property. | Land | Improvement |
|---|---|---|---|---|
| 2025 | $1,031 | $133,300 | $0 | $0 |
| 2024 | $1,081 | $135,420 | $0 | $0 |
| 2023 | $1,253 | $149,600 | $0 | $0 |
| 2022 | $1,283 | $143,000 | $0 | $0 |
| 2021 | $10 | $173,640 | $30,000 | $143,640 |
| 2020 | $966 | $149,700 | $30,000 | $119,700 |
| 2019 | $816 | $121,058 | $30,000 | $91,058 |
| 2018 | $791 | $107,168 | $30,000 | $77,168 |
| 2017 | $760 | $54,395 | $0 | $0 |
| 2016 | $788 | $43,890 | $0 | $0 |
| 2015 | $636 | $43,890 | $0 | $0 |
| 2014 | $607 | $46,330 | $0 | $0 |
| 2013 | -- | $46,330 | $0 | $0 |
Source: Public Records
Map
Nearby Homes
- 1194 N 120 W
- 1196 N 120 W
- 1200 N 120 W
- 95 W 1150 N
- 1204 N 120 W
- 1206 N 120 W
- 1208 N 120 W
- 1193 N 120 W Unit 1
- 1193 N 120 W
- 1195 N 120 W
- 1197 N 120 W
- 1179 N 120 W
- 40 W Cache Valley Blvd Unit 8 B&D
- 40 W Cache Valley Blvd Unit 8 A&C
- 40 W Cache Valley Blvd Unit 5A
- 40 W Cache Valley Blvd Unit C
- 40 W Cache Valley Blvd Unit 6B
- 40 W Cache Valley Blvd Unit 8B
- 40 W Cache Valley Blvd Unit 19
- 40 W Cache Valley Blvd