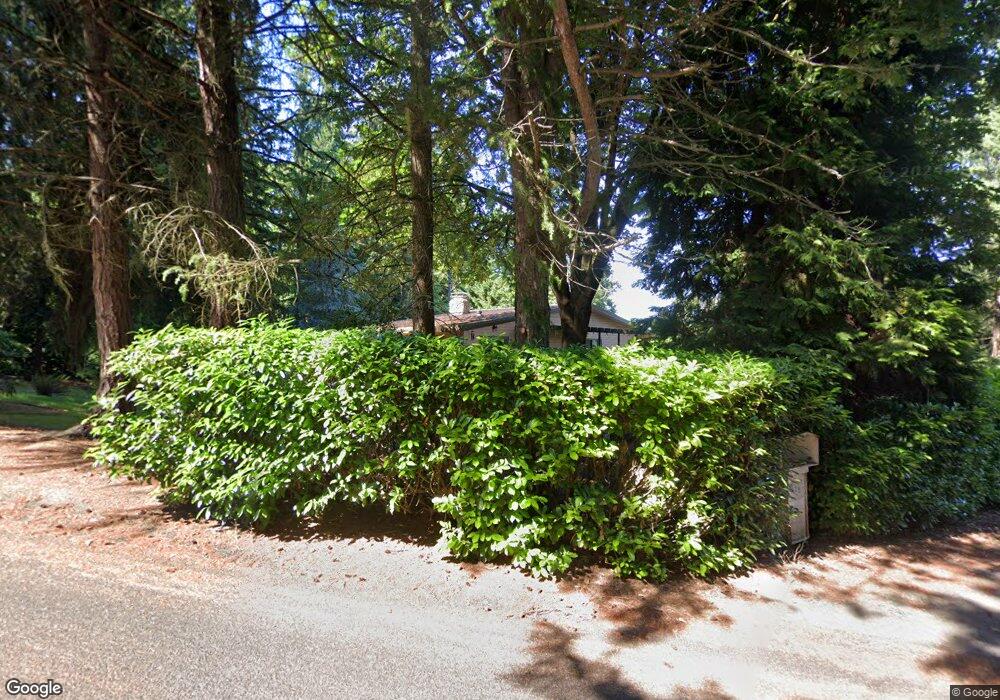
11921 139th Ave E Puyallup, WA 98374
Estimated Value: $672,243 - $731,000
3
Beds
3
Baths
2,494
Sq Ft
$280/Sq Ft
Est. Value
About This Home
This home is located at 11921 139th Ave E, Puyallup, WA 98374 and is currently estimated at $699,061, approximately $280 per square foot. 11921 139th Ave E is a home located in Pierce County with nearby schools including Ferrucci Junior High School, Emerald Ridge High School, and Northwest Christian School.
Ownership History
Date
Name
Owned For
Owner Type
Purchase Details
Closed on
Jun 2, 2015
Sold by
Metzler Alan M and Timm Kathryn L
Bought by
Metzler Alan M and Timm Kathryn L
Current Estimated Value
Home Financials for this Owner
Home Financials are based on the most recent Mortgage that was taken out on this home.
Original Mortgage
$220,700
Outstanding Balance
$83,192
Interest Rate
3.62%
Mortgage Type
New Conventional
Estimated Equity
$615,869
Purchase Details
Closed on
Apr 26, 2007
Sold by
Aanderud Cecelia S
Bought by
Metzler Alan M and Timm Kathryn L
Home Financials for this Owner
Home Financials are based on the most recent Mortgage that was taken out on this home.
Original Mortgage
$276,000
Interest Rate
6.11%
Mortgage Type
New Conventional
Purchase Details
Closed on
May 25, 2001
Sold by
Aanderud Richie L
Bought by
Aanderud Cecelia S
Create a Home Valuation Report for This Property
The Home Valuation Report is an in-depth analysis detailing your home's value as well as a comparison with similar homes in the area
Home Values in the Area
Average Home Value in this Area
Purchase History
| Date | Buyer | Sale Price | Title Company |
|---|---|---|---|
| Metzler Alan M | -- | First American Title Ins Co | |
| Metzler Alan M | $345,000 | Ticor Title Company | |
| Aanderud Cecelia S | -- | -- |
Source: Public Records
Mortgage History
| Date | Status | Borrower | Loan Amount |
|---|---|---|---|
| Open | Metzler Alan M | $220,700 | |
| Closed | Metzler Alan M | $276,000 |
Source: Public Records
Tax History Compared to Growth
Tax History
| Year | Tax Paid | Tax Assessment Tax Assessment Total Assessment is a certain percentage of the fair market value that is determined by local assessors to be the total taxable value of land and additions on the property. | Land | Improvement |
|---|---|---|---|---|
| 2025 | $6,147 | $624,900 | $242,300 | $382,600 |
| 2024 | $6,147 | $617,900 | $245,500 | $372,400 |
| 2023 | $6,147 | $588,000 | $237,400 | $350,600 |
| 2022 | $5,837 | $597,300 | $243,900 | $353,400 |
| 2021 | $5,582 | $434,800 | $194,900 | $239,900 |
| 2019 | $4,925 | $403,700 | $165,400 | $238,300 |
| 2018 | $4,991 | $381,500 | $152,000 | $229,500 |
| 2017 | $4,696 | $345,500 | $135,900 | $209,600 |
| 2016 | -- | $282,500 | $109,100 | $173,400 |
| 2014 | $3,669 | $247,300 | $85,600 | $161,700 |
| 2013 | $3,669 | $228,600 | $76,900 | $151,700 |
Source: Public Records
Map
Nearby Homes
- 13915 120th St E
- 11618 Jennifer Ct E
- 13712 116th Street Ct E
- 13502 118th St E
- 11402 136th Ave E
- 11318 136th Ave E
- 12416 143rd Ave E
- 11505 134th Avenue Ct E
- 11704 132nd Avenue Ct E
- 11421 133rd Ave E
- 11312 134th Avenue Ct E
- 12713 142nd Avenue Ct E Unit 4
- 13208 116th Street Ct E
- 12430 136th Ave E
- 11726 130th Avenue Ct E
- 12601 132nd Avenue Ct E Unit A20
- 15002 116th St E
- 12815 123rd Street Ct E
- 12437 129th Ave E Unit C13
- 14927 128th St E
- 17832 139th Ave E
- 17832 139th Ave E Unit 31
- 17932 139th Ave E Unit 31
- 11915 139th Ave E
- 17952 139th Ave E Unit 26
- 13921 120th St E
- 11901 139th Ave E
- 13920 120th St E
- 13817 120th St E
- 11914 139th Ave E
- 139th 120th Ave E
- 13814 120th St E
- 13809 120th St E
- 13903 Old Military Rd
- 13903 Military Rd E
- 13801 120th St E
- 13918 122nd St E
- 13806 120th St E
- 11723 136th Ave E
- 11711 136th Ave E