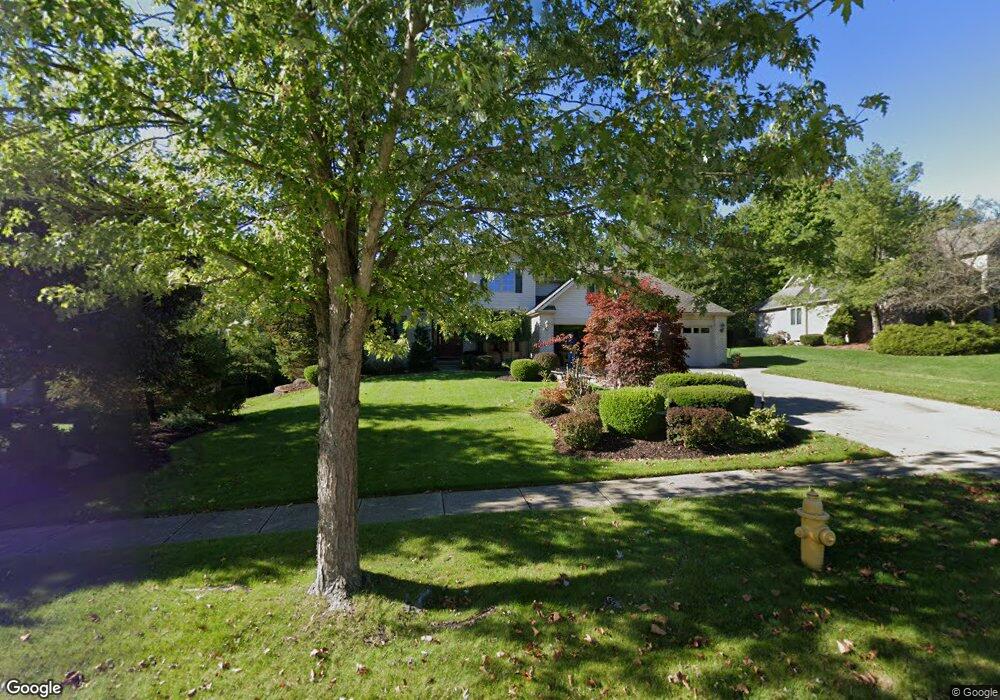
11921 Nottingham Pkwy North Royalton, OH 44133
Estimated Value: $483,000 - $657,000
4
Beds
4
Baths
3,200
Sq Ft
$177/Sq Ft
Est. Value
About This Home
This home is located at 11921 Nottingham Pkwy, North Royalton, OH 44133 and is currently estimated at $566,400, approximately $177 per square foot. 11921 Nottingham Pkwy is a home located in Cuyahoga County with nearby schools including North Royalton Middle School, North Royalton High School, and Saint Albert the Great Roman Catholic School.
Ownership History
Date
Name
Owned For
Owner Type
Purchase Details
Closed on
May 31, 2011
Sold by
Anselmo Joseph and Anselmo Alice M
Bought by
Armitage James R and Armitage Sherry L
Current Estimated Value
Home Financials for this Owner
Home Financials are based on the most recent Mortgage that was taken out on this home.
Original Mortgage
$276,000
Outstanding Balance
$191,868
Interest Rate
4.81%
Mortgage Type
New Conventional
Estimated Equity
$374,532
Purchase Details
Closed on
Jul 9, 2001
Sold by
Anselmo Joseph
Bought by
Anselmo Joseph
Purchase Details
Closed on
Dec 23, 1998
Sold by
Cosmpolitan Homes Inc
Bought by
Anselmo Joseph and Anselmo Laureen M
Home Financials for this Owner
Home Financials are based on the most recent Mortgage that was taken out on this home.
Original Mortgage
$180,000
Interest Rate
6.95%
Purchase Details
Closed on
May 30, 1997
Sold by
Pfr Land Co
Bought by
Cosmopolitan Homes Inc
Create a Home Valuation Report for This Property
The Home Valuation Report is an in-depth analysis detailing your home's value as well as a comparison with similar homes in the area
Home Values in the Area
Average Home Value in this Area
Purchase History
| Date | Buyer | Sale Price | Title Company |
|---|---|---|---|
| Armitage James R | $345,000 | Title Alliance | |
| Anselmo Joseph | -- | -- | |
| Anselmo Joseph | $240,200 | Approved Statewide Title Age | |
| Cosmopolitan Homes Inc | $55,000 | -- |
Source: Public Records
Mortgage History
| Date | Status | Borrower | Loan Amount |
|---|---|---|---|
| Open | Armitage James R | $276,000 | |
| Previous Owner | Anselmo Joseph | $180,000 |
Source: Public Records
Tax History Compared to Growth
Tax History
| Year | Tax Paid | Tax Assessment Tax Assessment Total Assessment is a certain percentage of the fair market value that is determined by local assessors to be the total taxable value of land and additions on the property. | Land | Improvement |
|---|---|---|---|---|
| 2024 | $9,303 | $160,160 | $32,270 | $127,890 |
| 2023 | $8,311 | $131,220 | $25,170 | $106,050 |
| 2022 | $8,254 | $131,220 | $25,170 | $106,050 |
| 2021 | $8,341 | $131,220 | $25,170 | $106,050 |
| 2020 | $8,360 | $124,990 | $23,980 | $101,010 |
| 2019 | $8,115 | $357,100 | $68,500 | $288,600 |
| 2018 | $8,124 | $124,990 | $23,980 | $101,010 |
| 2017 | $8,588 | $124,990 | $27,480 | $97,510 |
| 2016 | $8,047 | $124,990 | $27,480 | $97,510 |
| 2015 | $7,874 | $124,990 | $27,480 | $97,510 |
| 2014 | $7,874 | $121,350 | $26,670 | $94,680 |
Source: Public Records
Map
Nearby Homes
- 18680 Bennett Rd
- 11886 Friar Post
- 10244 Hidden Valley Dr
- 11438 Drake Rd
- 20745 Evergreen Trail
- 10281 River Run Ln
- 2160 Boston Rd Unit B
- 2160 Boston Rd Unit AB
- 17390 Bennett Rd
- 0 V L Boston Rd Unit 5138046
- 13335 Tradewinds Dr
- 13448 Compass Point Dr
- 19252 Hidden Woods Ln
- VL 2 Hidden Ridge Rd
- VL 5 Hidden Ridge Rd
- VL3 Hidden Ridge Rd
- VL4 Hidden Ridge Rd
- 14132 Walking Stick Way
- 9447 Lindberg Dr
- 106 Briarleigh Dr
- 11931 Nottingham Pkwy
- 11911 Nottingham Pkwy
- 11941 Nottingham Pkwy
- 11920 Nottingham Pkwy
- 11951 Nottingham Pkwy
- 11940 Nottingham Pkwy
- 11901 Nottingham Pkwy
- 11930 Nottingham Pkwy
- 11950 Nottingham Pkwy
- 19412 Rye Gate Dr
- 19442 Rye Gate Dr
- 18753 Bennett Rd
- 11891 Nottingham Pkwy
- 19402 Rye Gate Dr
- 19452 Rye Gate Dr
- 18497 Bennett Rd
- 19392 Rye Gate Dr
- 18521 Bennett Rd
- 18477 Bennett Rd
- 18533 Bennett Rd