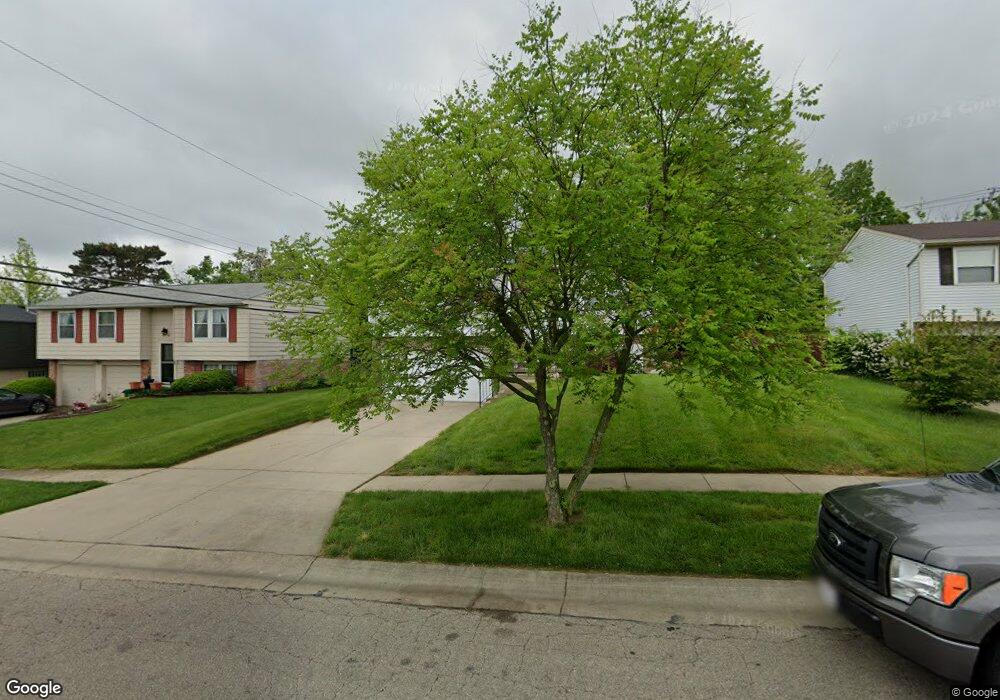
11929 Hitchcock Dr Cincinnati, OH 45240
Estimated Value: $231,000 - $255,000
3
Beds
2
Baths
1,572
Sq Ft
$153/Sq Ft
Est. Value
About This Home
This home is located at 11929 Hitchcock Dr, Cincinnati, OH 45240 and is currently estimated at $239,748, approximately $152 per square foot. 11929 Hitchcock Dr is a home located in Hamilton County with nearby schools including Calvary Academy- The and St Gabriel Consolidated School.
Ownership History
Date
Name
Owned For
Owner Type
Purchase Details
Closed on
Aug 29, 2006
Sold by
Thomas Mary A
Bought by
Goode Cecily J
Current Estimated Value
Home Financials for this Owner
Home Financials are based on the most recent Mortgage that was taken out on this home.
Original Mortgage
$115,000
Outstanding Balance
$68,415
Interest Rate
6.88%
Mortgage Type
Unknown
Estimated Equity
$171,333
Create a Home Valuation Report for This Property
The Home Valuation Report is an in-depth analysis detailing your home's value as well as a comparison with similar homes in the area
Home Values in the Area
Average Home Value in this Area
Purchase History
| Date | Buyer | Sale Price | Title Company |
|---|---|---|---|
| Goode Cecily J | -- | None Available |
Source: Public Records
Mortgage History
| Date | Status | Borrower | Loan Amount |
|---|---|---|---|
| Open | Goode Cecily J | $115,000 |
Source: Public Records
Tax History
| Year | Tax Paid | Tax Assessment Tax Assessment Total Assessment is a certain percentage of the fair market value that is determined by local assessors to be the total taxable value of land and additions on the property. | Land | Improvement |
|---|---|---|---|---|
| 2025 | $3,243 | $55,077 | $9,251 | $45,826 |
| 2024 | $3,156 | $55,077 | $9,251 | $45,826 |
| 2023 | $3,200 | $55,077 | $9,251 | $45,826 |
| 2022 | $3,112 | $40,551 | $7,357 | $33,194 |
| 2021 | $3,039 | $40,551 | $7,357 | $33,194 |
| 2020 | $3,078 | $40,551 | $7,357 | $33,194 |
| 2019 | $2,921 | $33,793 | $6,132 | $27,661 |
| 2018 | $2,928 | $33,793 | $6,132 | $27,661 |
| 2017 | $2,817 | $33,793 | $6,132 | $27,661 |
| 2016 | $2,814 | $33,072 | $6,419 | $26,653 |
| 2015 | $2,611 | $33,072 | $6,419 | $26,653 |
| 2014 | $2,410 | $33,072 | $6,419 | $26,653 |
| 2013 | $2,485 | $34,815 | $6,759 | $28,056 |
Source: Public Records
Map
Nearby Homes
- 993 Havensport Dr
- 12091 Hitchcock Dr
- 805 Halesworth Dr
- 3311 Greenwich Dr
- 11839 Hamlet Rd
- 888 W Kemper Rd
- 12069 Cantrell Dr
- 3323 Devonian Dr
- 694 Park Ave
- 1352 Forester Dr
- 1364 Karahill Dr
- 11481 Fremantle Dr
- 920 Waycross Rd
- 5985 Flaig Dr
- 11431 Fremantle Dr
- 1407 Graymont Ct
- 1480 Kelvin Ct
- 52 Applewood Dr
- 96 Twin Lakes Dr
- 27 Wildwood Dr Unit 179
- 11939 Hitchcock Dr
- 11917 Hitchcock Dr
- 11907 Hitchcock Dr
- 999 Havensport Dr
- 11920 Hitchcock Dr
- 11959 Hitchcock Dr
- 11910 Hitchcock Dr
- 997 Havensport Dr
- 11952 Hitchcock Dr
- 11971 Hitchcock Dr
- 995 Havensport Dr
- 986 Smiley Ave
- 11903 Hitchcock Dr
- 11962 Hitchcock Dr
- 996 Havensport Dr
- 11981 Hitchcock Dr
- 984 Smiley Ave
- 989 Smiley Ave
- 11899 Hitchcock Dr
- 994 Havensport Dr
Your Personal Tour Guide
Ask me questions while you tour the home.