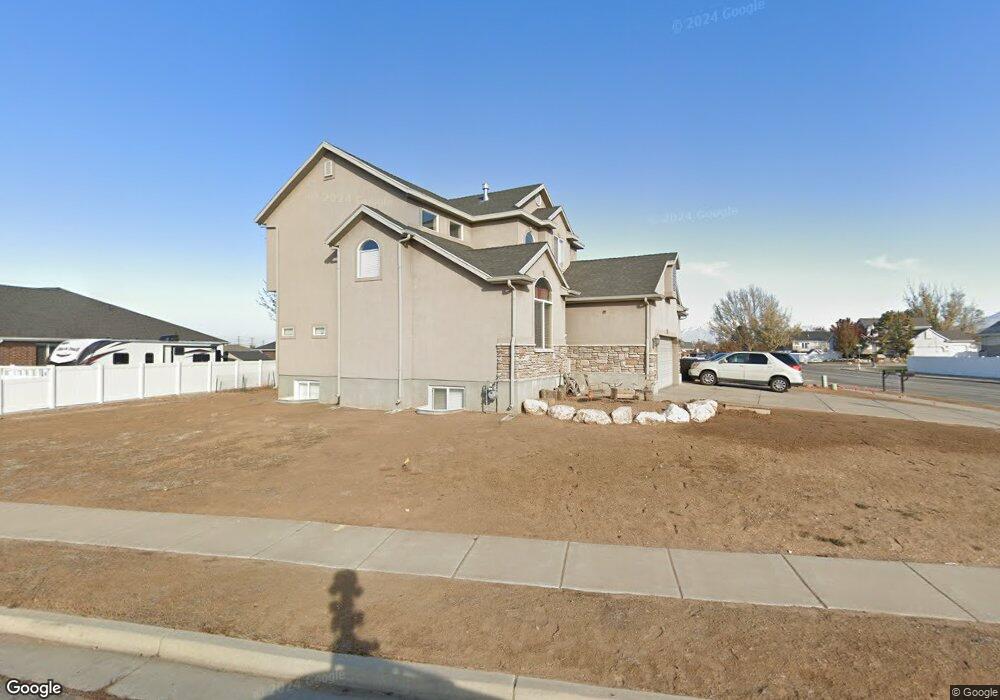
1193 N 1285 W Clearfield, UT 84015
Estimated Value: $532,000 - $633,000
5
Beds
4
Baths
3,377
Sq Ft
$166/Sq Ft
Est. Value
About This Home
This home is located at 1193 N 1285 W, Clearfield, UT 84015 and is currently estimated at $559,692, approximately $165 per square foot. 1193 N 1285 W is a home located in Davis County with nearby schools including Clinton Elementary School, Sunset Junior High School, and Clearfield High School.
Ownership History
Date
Name
Owned For
Owner Type
Purchase Details
Closed on
Feb 16, 2022
Sold by
Aucourant Inc
Bought by
Dorius Val
Current Estimated Value
Purchase Details
Closed on
Nov 7, 2018
Sold by
Smith Dean B and Coorner Smith Cynthia A
Bought by
Au Courant Inc
Purchase Details
Closed on
Jun 23, 2005
Sold by
Gmw Development Inc
Bought by
Smith Dean B and Coomer Smith Cynthia A
Home Financials for this Owner
Home Financials are based on the most recent Mortgage that was taken out on this home.
Original Mortgage
$250,267
Interest Rate
5.72%
Mortgage Type
VA
Create a Home Valuation Report for This Property
The Home Valuation Report is an in-depth analysis detailing your home's value as well as a comparison with similar homes in the area
Home Values in the Area
Average Home Value in this Area
Purchase History
| Date | Buyer | Sale Price | Title Company |
|---|---|---|---|
| Dorius Val | -- | None Listed On Document | |
| Au Courant Inc | -- | None Available | |
| Smith Dean B | -- | Cottonwood Title Ins Agency |
Source: Public Records
Mortgage History
| Date | Status | Borrower | Loan Amount |
|---|---|---|---|
| Previous Owner | Smith Dean B | $250,267 |
Source: Public Records
Tax History Compared to Growth
Tax History
| Year | Tax Paid | Tax Assessment Tax Assessment Total Assessment is a certain percentage of the fair market value that is determined by local assessors to be the total taxable value of land and additions on the property. | Land | Improvement |
|---|---|---|---|---|
| 2025 | $2,774 | $266,750 | $89,121 | $177,629 |
| 2024 | $2,794 | $270,049 | $97,619 | $172,430 |
| 2023 | $2,645 | $260,150 | $61,417 | $198,732 |
| 2022 | $2,813 | $506,000 | $122,862 | $383,138 |
| 2021 | $2,569 | $377,000 | $85,838 | $291,162 |
| 2020 | $2,231 | $324,000 | $73,604 | $250,396 |
| 2019 | $2,107 | $299,000 | $84,781 | $214,219 |
| 2018 | $1,987 | $277,000 | $71,450 | $205,550 |
| 2016 | $1,789 | $128,810 | $26,380 | $102,430 |
| 2015 | $1,766 | $120,890 | $26,380 | $94,510 |
| 2014 | $1,750 | $121,669 | $26,380 | $95,289 |
| 2013 | -- | $130,043 | $27,143 | $102,900 |
Source: Public Records
Map
Nearby Homes