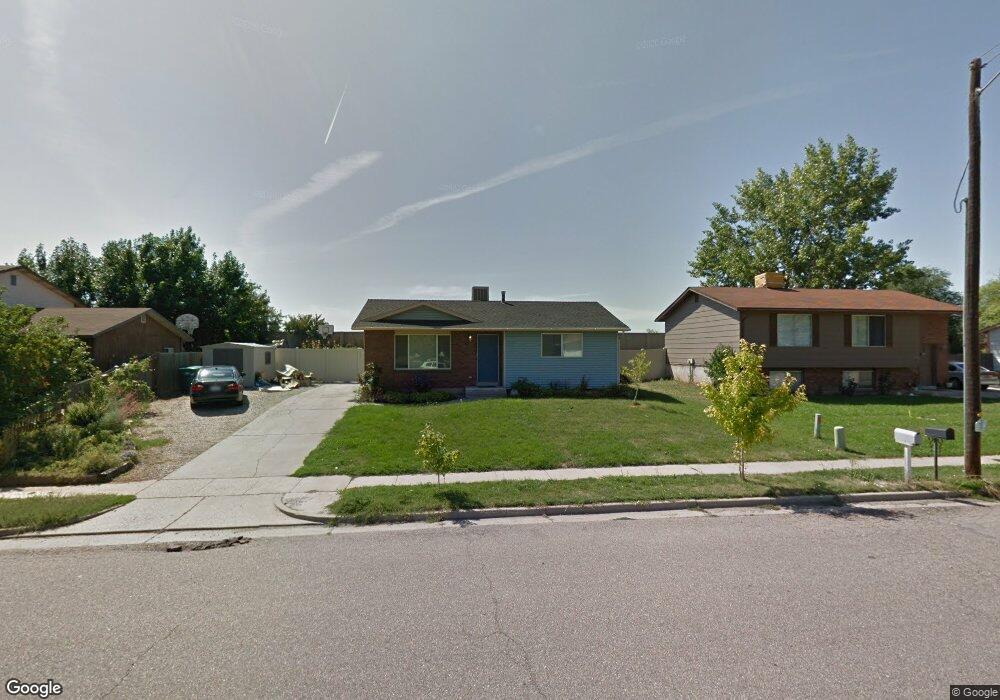
1193 N 1640 W Layton, UT 84041
Estimated Value: $387,000 - $416,239
3
Beds
2
Baths
1,897
Sq Ft
$211/Sq Ft
Est. Value
About This Home
This home is located at 1193 N 1640 W, Layton, UT 84041 and is currently estimated at $400,560, approximately $211 per square foot. 1193 N 1640 W is a home located in Davis County with nearby schools including Central Davis Junior High School, Layton High School, and North Davis Preparatory Academy.
Ownership History
Date
Name
Owned For
Owner Type
Purchase Details
Closed on
Jul 26, 2011
Sold by
Tolman Jordan M and Tolman Jami L
Bought by
Nielsen Kevin T and Nielsen Grace K
Current Estimated Value
Home Financials for this Owner
Home Financials are based on the most recent Mortgage that was taken out on this home.
Original Mortgage
$136,192
Outstanding Balance
$93,475
Interest Rate
4.46%
Mortgage Type
VA
Estimated Equity
$307,085
Purchase Details
Closed on
Jul 21, 2006
Sold by
Wm Specialty Mortgage Llc
Bought by
Tolman Jordan M and Tolman Jami L
Home Financials for this Owner
Home Financials are based on the most recent Mortgage that was taken out on this home.
Original Mortgage
$91,900
Interest Rate
6.87%
Mortgage Type
Purchase Money Mortgage
Purchase Details
Closed on
Apr 25, 2006
Sold by
Winterton Neil H and Winterton Judy
Bought by
Wm Specialty Mortgage Llc
Create a Home Valuation Report for This Property
The Home Valuation Report is an in-depth analysis detailing your home's value as well as a comparison with similar homes in the area
Home Values in the Area
Average Home Value in this Area
Purchase History
| Date | Buyer | Sale Price | Title Company |
|---|---|---|---|
| Nielsen Kevin T | -- | First American Title | |
| Tolman Jordan M | -- | Founders Title Co Layton | |
| Wm Specialty Mortgage Llc | $120,275 | None Available |
Source: Public Records
Mortgage History
| Date | Status | Borrower | Loan Amount |
|---|---|---|---|
| Open | Nielsen Kevin T | $136,192 | |
| Previous Owner | Tolman Jordan M | $91,900 |
Source: Public Records
Tax History Compared to Growth
Tax History
| Year | Tax Paid | Tax Assessment Tax Assessment Total Assessment is a certain percentage of the fair market value that is determined by local assessors to be the total taxable value of land and additions on the property. | Land | Improvement |
|---|---|---|---|---|
| 2025 | $1,860 | $195,250 | $91,073 | $104,177 |
| 2024 | $1,826 | $193,050 | $108,679 | $84,371 |
| 2023 | $1,781 | $332,000 | $139,714 | $192,286 |
| 2022 | $1,907 | $193,050 | $65,964 | $127,086 |
| 2021 | $1,669 | $252,000 | $94,485 | $157,515 |
| 2020 | $1,478 | $214,000 | $69,928 | $144,072 |
| 2019 | $1,474 | $209,000 | $67,240 | $141,760 |
| 2018 | $1,278 | $182,000 | $62,260 | $119,740 |
| 2016 | $1,133 | $83,215 | $17,718 | $65,497 |
| 2015 | $1,113 | $77,605 | $17,718 | $59,887 |
| 2014 | $1,059 | $75,534 | $17,718 | $57,816 |
| 2013 | -- | $72,566 | $20,680 | $51,886 |
Source: Public Records
Map
Nearby Homes
- 1133 Laytona Dr
- Fremont Plan at Trailside
- Blakely Plan at Trailside
- Arlington Plan at Trailside
- Savannah Plan at Trailside
- Charlotte Plan at Trailside
- Birmingham Plan at Trailside
- Oakridge Plan at Trailside
- Middleton Plan at Trailside
- Wilmington Plan at Trailside
- 1211 N 1875 W Unit 211
- 1211 N 1875 W
- 1219 N 1875 W
- 1219 N 1875 W Unit 212
- 1523 Sherma Ave
- 1493 Marilyn Dr
- 1456 Scott Cir
- 979 Cold Creek Way
- 1254 Marilyn Dr
- 916 Cold Creek Way
- 1199 N 1640 W
- 1181 N 1640 W
- 1203 N 1640 W
- 1173 N 1640 W
- 1541 W 1200 N
- 1182 N 1640 W
- 1208 N 1640 W
- 1213 N 1640 W
- 1169 N 1640 W
- 1546 W 1200 N
- 1170 N 1640 W
- 1224 N 1640 W
- 1519 W 1200 N
- 1538 W 1200 N
- 1163 N 1640 W
- 1223 N 1640 W
- 2600 N Hill Rd Unit 41
- 2600 N Hill Rd Unit 12
- 2600 N Hill Rd Unit 105
- 2600 N Hill Rd