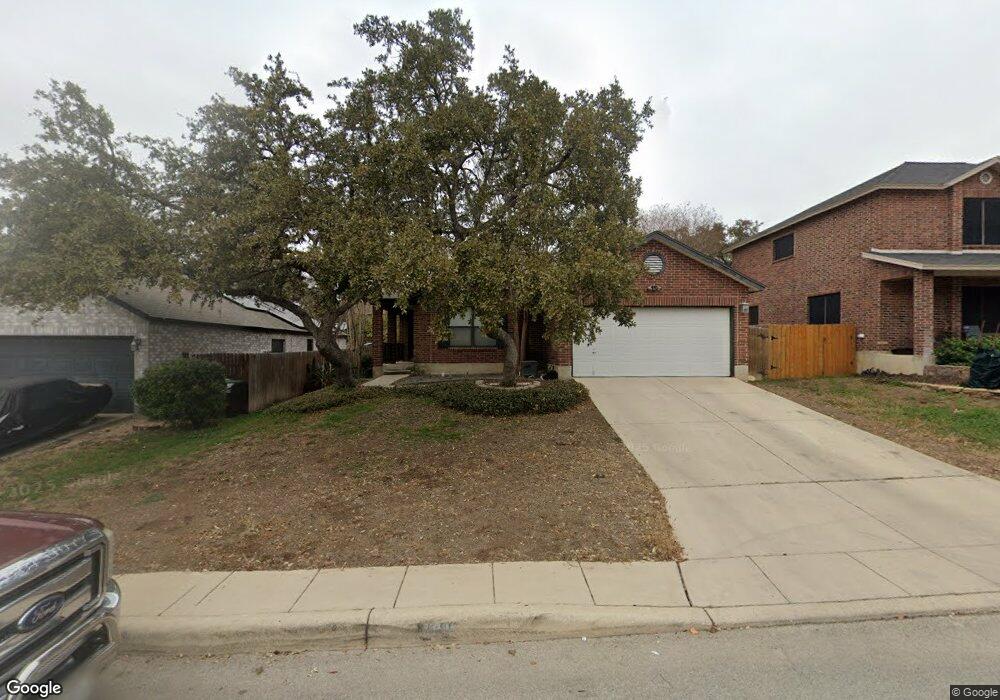
11931 Altamonte Oaks San Antonio, TX 78253
Villages of Westcreek NeighborhoodEstimated Value: $258,000 - $287,000
3
Beds
2
Baths
1,614
Sq Ft
$166/Sq Ft
Est. Value
About This Home
This home is located at 11931 Altamonte Oaks, San Antonio, TX 78253 and is currently estimated at $267,638, approximately $165 per square foot. 11931 Altamonte Oaks is a home located in Bexar County with nearby schools including Clarence Galm Elementary School, Luna Middle School, and Brennan High School.
Ownership History
Date
Name
Owned For
Owner Type
Purchase Details
Closed on
May 2, 2019
Sold by
Ewan David M and Ewan Jade M
Bought by
Castro Merari A and Pinkham Robert W
Current Estimated Value
Home Financials for this Owner
Home Financials are based on the most recent Mortgage that was taken out on this home.
Original Mortgage
$189,012
Outstanding Balance
$167,172
Interest Rate
4.5%
Mortgage Type
FHA
Estimated Equity
$100,466
Purchase Details
Closed on
Jan 18, 2010
Sold by
Olmeda Samuel G and Olmeda Dora S
Bought by
Ewan David M and Ewan Jade M
Home Financials for this Owner
Home Financials are based on the most recent Mortgage that was taken out on this home.
Original Mortgage
$129,609
Interest Rate
4.93%
Mortgage Type
FHA
Purchase Details
Closed on
Jun 12, 1998
Sold by
Kauman & Broad Of Texas Ltd
Bought by
Olmeda Samuel G and Olmeda Dora S
Home Financials for this Owner
Home Financials are based on the most recent Mortgage that was taken out on this home.
Original Mortgage
$94,632
Interest Rate
7.17%
Mortgage Type
FHA
Create a Home Valuation Report for This Property
The Home Valuation Report is an in-depth analysis detailing your home's value as well as a comparison with similar homes in the area
Home Values in the Area
Average Home Value in this Area
Purchase History
| Date | Buyer | Sale Price | Title Company |
|---|---|---|---|
| Castro Merari A | -- | Alamo Title Co | |
| Ewan David M | -- | None Available | |
| Olmeda Samuel G | -- | -- |
Source: Public Records
Mortgage History
| Date | Status | Borrower | Loan Amount |
|---|---|---|---|
| Open | Castro Merari A | $189,012 | |
| Previous Owner | Ewan David M | $129,609 | |
| Previous Owner | Olmeda Samuel G | $94,632 |
Source: Public Records
Tax History Compared to Growth
Tax History
| Year | Tax Paid | Tax Assessment Tax Assessment Total Assessment is a certain percentage of the fair market value that is determined by local assessors to be the total taxable value of land and additions on the property. | Land | Improvement |
|---|---|---|---|---|
| 2025 | $3,136 | $248,210 | $55,650 | $192,560 |
| 2024 | $3,136 | $240,860 | $55,650 | $185,210 |
| 2023 | $3,136 | $219,409 | $55,650 | $179,330 |
| 2022 | $4,032 | $199,463 | $46,420 | $174,790 |
| 2021 | $3,811 | $181,330 | $42,230 | $139,100 |
| 2020 | $3,608 | $167,750 | $31,830 | $135,920 |
| 2019 | $3,649 | $164,330 | $31,830 | $132,500 |
| 2018 | $3,566 | $160,470 | $31,830 | $128,640 |
| 2017 | $3,316 | $148,880 | $31,830 | $117,050 |
| 2016 | $3,135 | $140,760 | $31,830 | $108,930 |
| 2015 | $2,578 | $131,120 | $25,530 | $105,590 |
| 2014 | $2,578 | $124,260 | $0 | $0 |
Source: Public Records
Map
Nearby Homes
- 11910 Wilby Creek
- 11935 Devin Chase
- 2042 Buckner Pass
- 12176 Tower Forest
- 1401 Dezarae
- 2012 Cottonwood Way
- 12307 Tower Forest
- 2035 Tillman Park
- 2114 Derussy Rd
- 11538 Biddle Heights
- 1485 Pitcher Bend
- 11518 Biddle Heights
- 1522 Winans Pass
- 12019 Bailey Hills
- 1470 Pitcher Bend
- 2022 Wilby Ln
- 2131 Thayer Cove
- 1916 Wilby Ln
- 12211 Upton Park
- 12323 Merritt Villa
- 11927 Altamonte Oaks
- 11935 Altamonte Oaks
- 11923 Altamonte Oaks
- 11830 Brandon Oaks
- 11826 Brandon Oaks
- 11834 Brandon Oaks
- 11930 Altamonte Oaks
- 11919 Altamonte Oaks
- 11822 Brandon Oaks
- 11926 Altamonte Oaks
- 11934 Altamonte Oaks
- 11922 Altamonte Oaks
- 11818 Brandon Oaks
- 2107 Sage Run
- 11915 Altamonte Oaks
- 2103 Sage Run
- 11918 Altamonte Oaks
- 2019 Sage Run
- 11814 Brandon Oaks
- 2015 Sage Run