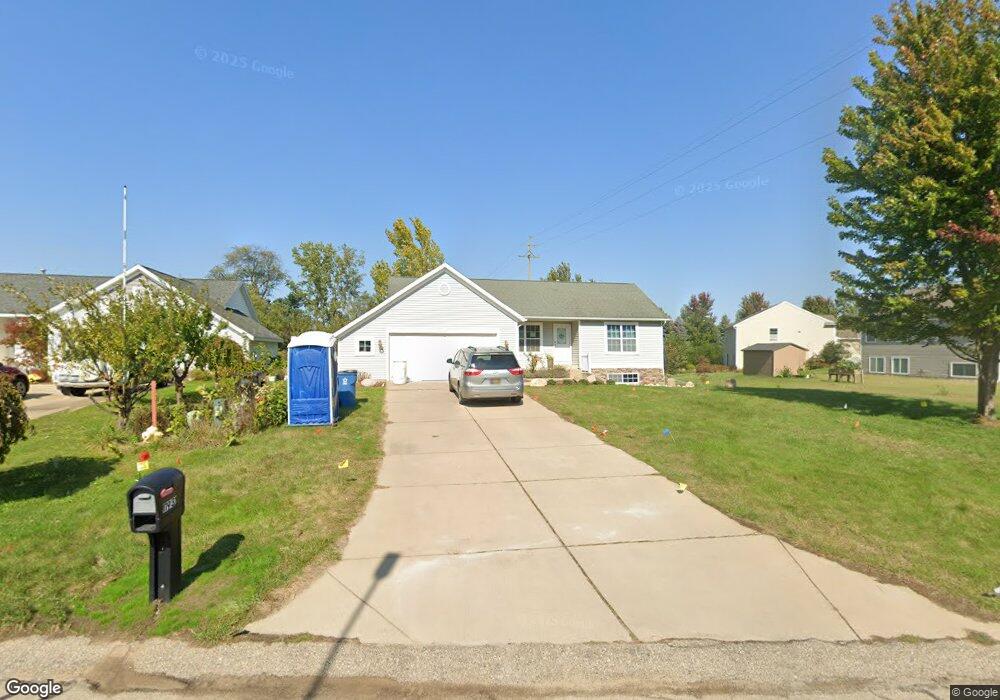
11931 Jonker Way Holland, MI 49424
Estimated Value: $272,000 - $372,000
--
Bed
2
Baths
973
Sq Ft
$338/Sq Ft
Est. Value
About This Home
This home is located at 11931 Jonker Way, Holland, MI 49424 and is currently estimated at $329,175, approximately $338 per square foot. 11931 Jonker Way is a home located in Ottawa County with nearby schools including Pine Creek Elementary School, Harbor Lights Middle School, and West Ottawa High School.
Ownership History
Date
Name
Owned For
Owner Type
Purchase Details
Closed on
Mar 5, 2025
Sold by
Tan Wei Yu and Kan Har Ye
Bought by
Wei Yu Tan And Har Ye Kan Joint Living Trust and Tan
Current Estimated Value
Purchase Details
Closed on
May 13, 2016
Sold by
East Meadows Llc
Bought by
Ye Tan Wei Yu and Ye Kan Har
Home Financials for this Owner
Home Financials are based on the most recent Mortgage that was taken out on this home.
Original Mortgage
$149,400
Interest Rate
3.59%
Mortgage Type
New Conventional
Purchase Details
Closed on
Feb 8, 2016
Sold by
Houy Heat and Sao Sareth
Bought by
East Meadows Llc
Purchase Details
Closed on
Apr 4, 2011
Sold by
Schuh Corey and Schuh Laura
Bought by
East Meadows Llc
Purchase Details
Closed on
Sep 15, 2010
Sold by
Maung Phoenix and Maung Bangorn
Bought by
East Meadows Llc
Purchase Details
Closed on
Jan 20, 2010
Sold by
East Meadows Llc
Bought by
Maung Phoenix and Maung Bangorn
Create a Home Valuation Report for This Property
The Home Valuation Report is an in-depth analysis detailing your home's value as well as a comparison with similar homes in the area
Home Values in the Area
Average Home Value in this Area
Purchase History
| Date | Buyer | Sale Price | Title Company |
|---|---|---|---|
| Wei Yu Tan And Har Ye Kan Joint Living Trust | -- | None Listed On Document | |
| Ye Tan Wei Yu | $166,000 | Chicago Title Of Michigan | |
| East Meadows Llc | -- | Attorney | |
| East Meadows Llc | -- | None Available | |
| East Meadows Llc | -- | None Available | |
| Maung Phoenix | -- | None Available | |
| East Meadows Llc | -- | None Available |
Source: Public Records
Mortgage History
| Date | Status | Borrower | Loan Amount |
|---|---|---|---|
| Previous Owner | Ye Tan Wei Yu | $149,400 |
Source: Public Records
Tax History Compared to Growth
Tax History
| Year | Tax Paid | Tax Assessment Tax Assessment Total Assessment is a certain percentage of the fair market value that is determined by local assessors to be the total taxable value of land and additions on the property. | Land | Improvement |
|---|---|---|---|---|
| 2025 | $3,251 | $168,700 | $0 | $0 |
| 2024 | $2,463 | $148,300 | $0 | $0 |
| 2023 | $2,376 | $137,300 | $0 | $0 |
| 2022 | $2,981 | $115,600 | $0 | $0 |
| 2021 | $2,894 | $107,000 | $0 | $0 |
| 2020 | $2,863 | $96,400 | $0 | $0 |
| 2019 | $2,817 | $68,400 | $0 | $0 |
| 2018 | $2,507 | $85,900 | $17,500 | $68,400 |
| 2017 | $2,467 | $82,800 | $0 | $0 |
| 2016 | $2,125 | $76,900 | $0 | $0 |
| 2015 | $2,397 | $73,700 | $0 | $0 |
| 2014 | $2,397 | $67,400 | $0 | $0 |
Source: Public Records
Map
Nearby Homes
- 11835 Jonker Way
- 11772 Jonker Way
- 2978 Windy Willows Unit 79
- Lot 2 Union St
- Lot 3/4 Union St
- 12265 S Crystal Waters Dr Unit 6
- 3236 Waverly Park
- 0 N V L 120th
- 3072 Roberts Way
- 3329 120th Ave
- 442 120th Ave
- 11381 Pointe Lake Blvd
- 12274 James St
- 2556 van Ommen Dr
- 11952 Bush Ct Unit 29
- 11953 Bush Ct Unit 23
- 2992 Raspberry Ln
- 3033 Raspberry Ln Unit 55
- 12773 Felch St
- 3630 Tulipleaf Dr Unit Lot 241
- 11931 Jonker Way Unit 18
- 11941 Jonker Way
- 11941 Jonker Way Unit 19
- 11877 Jonker Way
- 11863 Jonker Way
- 11940 Jonker Way Unit 1
- 11932 Jonker Way
- 11918 Jonker Way
- 11918 Jonker Way Unit 7
- 11855 Jonker Way
- 11952 Jonker Way
- 11906 Jonker Way
- 11964 Jonker Way
- 2901 Willow Terrace Ct
- 2901 Willow Terrace Ct Unit 49
- 11896 Jonker Way
- 11852 Jonker Way
- 2905 Willow Terrace Ct
- 11972 Jonker Way
- 11843 Jonker Way