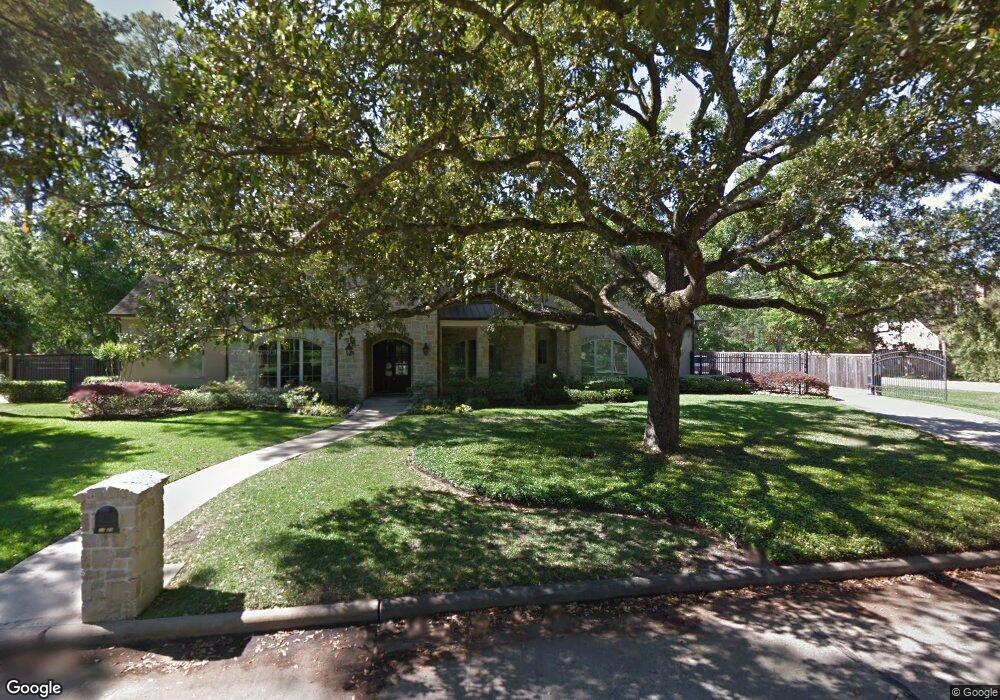
11935 Broken Bough Dr Houston, TX 77024
Estimated Value: $2,170,000 - $2,775,000
5
Beds
5
Baths
5,977
Sq Ft
$423/Sq Ft
Est. Value
About This Home
This home is located at 11935 Broken Bough Dr, Houston, TX 77024 and is currently estimated at $2,526,274, approximately $422 per square foot. 11935 Broken Bough Dr is a home located in Harris County with nearby schools including Bunker Hill Elementary School, Memorial Middle, and Memorial High School.
Ownership History
Date
Name
Owned For
Owner Type
Purchase Details
Closed on
Aug 12, 2010
Sold by
Childress Don E and Childress Shannon J
Bought by
Caesar William K and Caesar Minda M
Current Estimated Value
Home Financials for this Owner
Home Financials are based on the most recent Mortgage that was taken out on this home.
Original Mortgage
$550,000
Outstanding Balance
$369,622
Interest Rate
4.87%
Mortgage Type
New Conventional
Estimated Equity
$2,156,652
Purchase Details
Closed on
Apr 5, 2002
Sold by
Kotter Wayne A and Kotter Rebecca L
Bought by
Childress Ii Don E and Childress Shannon J
Home Financials for this Owner
Home Financials are based on the most recent Mortgage that was taken out on this home.
Original Mortgage
$360,000
Interest Rate
6.78%
Create a Home Valuation Report for This Property
The Home Valuation Report is an in-depth analysis detailing your home's value as well as a comparison with similar homes in the area
Home Values in the Area
Average Home Value in this Area
Purchase History
| Date | Buyer | Sale Price | Title Company |
|---|---|---|---|
| Caesar William K | -- | Old Republic Title Company O | |
| Childress Ii Don E | -- | Lawyers Title Company |
Source: Public Records
Mortgage History
| Date | Status | Borrower | Loan Amount |
|---|---|---|---|
| Open | Caesar William K | $550,000 | |
| Previous Owner | Childress Ii Don E | $360,000 |
Source: Public Records
Tax History Compared to Growth
Tax History
| Year | Tax Paid | Tax Assessment Tax Assessment Total Assessment is a certain percentage of the fair market value that is determined by local assessors to be the total taxable value of land and additions on the property. | Land | Improvement |
|---|---|---|---|---|
| 2025 | $30,902 | $2,344,595 | $1,084,185 | $1,260,410 |
| 2024 | $30,902 | $1,975,113 | $1,048,046 | $927,067 |
| 2023 | $30,902 | $2,065,716 | $993,836 | $1,071,880 |
| 2022 | $44,637 | $2,450,000 | $993,836 | $1,456,164 |
| 2021 | $42,264 | $1,951,581 | $939,627 | $1,011,954 |
| 2020 | $43,452 | $1,962,006 | $939,627 | $1,022,379 |
| 2019 | $44,403 | $1,925,000 | $939,627 | $985,373 |
| 2018 | $10,105 | $1,988,656 | $939,627 | $1,049,029 |
| 2017 | $45,872 | $1,988,656 | $939,627 | $1,049,029 |
| 2016 | $44,205 | $1,916,405 | $939,627 | $976,778 |
| 2015 | $30,808 | $2,078,618 | $939,627 | $1,138,991 |
| 2014 | $30,808 | $1,677,229 | $813,139 | $864,090 |
Source: Public Records
Map
Nearby Homes
- 601 Strey Ln
- 11910 Heritage Ln
- 12003 Tall Oaks St
- 12222 Broken Bough Dr
- 12 Gage Ct
- 711 Timber Hill Dr
- 11933 Barryknoll Ln
- 11905 Barryknoll Ln
- 12231 Kimberley Ln
- 11718 Broken Bough Cir
- 12326 Old Oaks Dr
- 827 Bunker Hill Rd
- 826 Bunker Hill Rd
- 11801 Barryknoll Ln
- 939 Memorial Village Dr Unit 38
- 345 Knipp Rd
- 12406 Overcup Dr
- 902 Memorial Village Dr Unit 66
- 11729 Joan of Arc Dr
- 979 Memorial Village Dr Unit 48
- 11931 Broken Bough Dr
- 11934 Cobblestone Dr
- 11934 Broken Bough Dr
- 11930 Cobblestone Dr
- 11930 Broken Bough Dr
- 12002 Cobblestone Dr
- 653 Strey Ln
- 11927 Broken Bough Dr
- 657 Strey Ln
- 11926 Cobblestone Dr
- 2 Huntington Park Ct
- 12003 Cobblestone Dr
- 11935 Cobblestone Dr
- 11926 Broken Bough Dr
- 11931 Cobblestone Dr
- 3 Huntington Park Ct
- 12006 Cobblestone Dr
- 675 Strey Ln
- 11923 Broken Bough Dr
- 11927 Cobblestone Dr