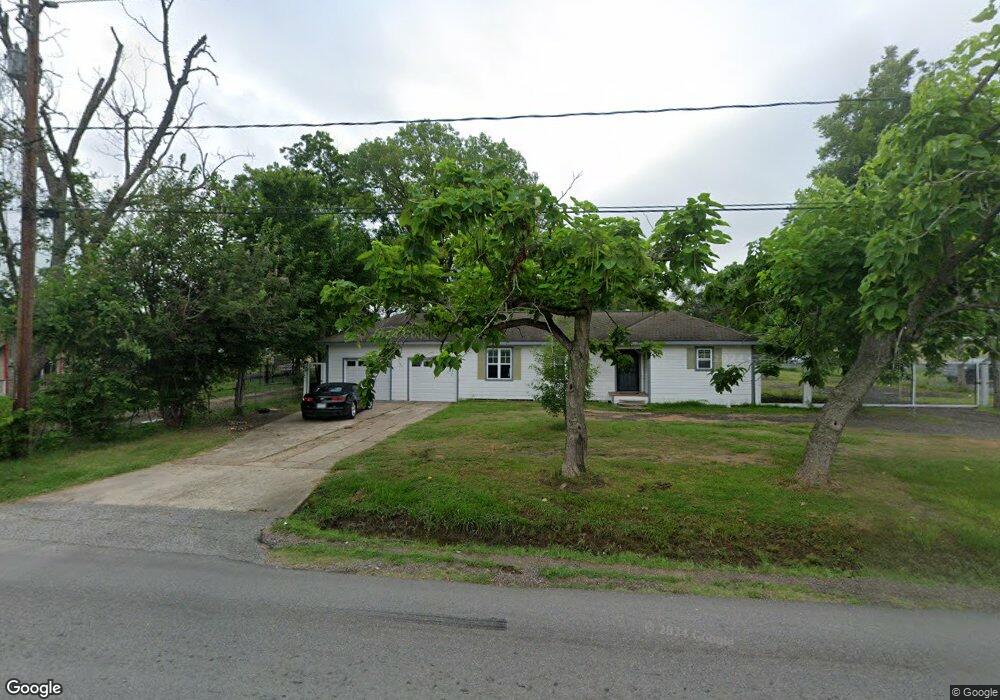
11936 Gloger St Houston, TX 77039
East Aldine NeighborhoodEstimated Value: $258,000 - $440,000
3
Beds
1
Bath
1,588
Sq Ft
$233/Sq Ft
Est. Value
About This Home
This home is located at 11936 Gloger St, Houston, TX 77039 and is currently estimated at $370,531, approximately $233 per square foot. 11936 Gloger St is a home located in Harris County with nearby schools including Vardeman EC/PK/K, Orange Grove Elementary School, and Macarthur Ninth Grade School.
Ownership History
Date
Name
Owned For
Owner Type
Purchase Details
Closed on
Oct 20, 2006
Sold by
Roberts Patra Mae
Bought by
Tovar Jose L and Tovar Elizabeth
Current Estimated Value
Home Financials for this Owner
Home Financials are based on the most recent Mortgage that was taken out on this home.
Original Mortgage
$20,000
Outstanding Balance
$11,875
Interest Rate
6.37%
Mortgage Type
Stand Alone Second
Estimated Equity
$358,656
Purchase Details
Closed on
Jan 25, 1999
Sold by
Nippert Wayne and Nippert Maglin
Bought by
Roberts Patra Mae
Home Financials for this Owner
Home Financials are based on the most recent Mortgage that was taken out on this home.
Original Mortgage
$25,000
Interest Rate
6%
Mortgage Type
Purchase Money Mortgage
Purchase Details
Closed on
Sep 15, 1998
Sold by
Gillies James E
Bought by
Nippert Wayne and Nippert Maglin
Create a Home Valuation Report for This Property
The Home Valuation Report is an in-depth analysis detailing your home's value as well as a comparison with similar homes in the area
Home Values in the Area
Average Home Value in this Area
Purchase History
| Date | Buyer | Sale Price | Title Company |
|---|---|---|---|
| Tovar Jose L | -- | None Available | |
| Roberts Patra Mae | -- | -- | |
| Nippert Wayne | -- | -- |
Source: Public Records
Mortgage History
| Date | Status | Borrower | Loan Amount |
|---|---|---|---|
| Open | Tovar Jose L | $20,000 | |
| Open | Tovar Jose L | $80,000 | |
| Previous Owner | Roberts Patra Mae | $25,000 |
Source: Public Records
Tax History Compared to Growth
Tax History
| Year | Tax Paid | Tax Assessment Tax Assessment Total Assessment is a certain percentage of the fair market value that is determined by local assessors to be the total taxable value of land and additions on the property. | Land | Improvement |
|---|---|---|---|---|
| 2025 | $231 | $380,000 | $341,436 | $38,564 |
| 2024 | $231 | $336,535 | $310,397 | $26,138 |
| 2023 | $231 | $352,435 | $310,397 | $42,038 |
| 2022 | $1,871 | $186,119 | $125,966 | $60,153 |
| 2021 | $1,782 | $82,700 | $69,281 | $13,419 |
| 2020 | $1,879 | $82,700 | $69,281 | $13,419 |
| 2019 | $1,967 | $82,700 | $69,281 | $13,419 |
| 2018 | $1,916 | $82,700 | $69,281 | $13,419 |
| 2017 | $1,874 | $82,700 | $69,281 | $13,419 |
| 2016 | $1,874 | $82,700 | $69,281 | $13,419 |
| 2015 | $871 | $82,700 | $69,281 | $13,419 |
| 2014 | $871 | $113,955 | $69,281 | $44,674 |
Source: Public Records
Map
Nearby Homes
- 11937 Connor St
- 11769 Gloger St
- 4002 Charriton Dr
- 4422 Sandydale Ln
- 3503 Debeney Dr
- 4803 Bethany Ln
- 4801 Marquita Ln
- 4522 Collins Rd
- 4739 Sandydale Ln
- 9213 Washington St
- 11781 Eastex Fwy
- 4703 Hollybrook Ln
- 2930 Bertrand St
- 2922 Bertrand St
- 4007 Wedgewood St
- 3111 Hartwick Rd
- 12123 Steeple Ln
- 4826 Anice St
- 4705 Lauder Rd
- 0 Lauder Rd
- 11945 Gloger St
- 11946 Gloger St
- 11922 Gloger St
- 11925 Gloger St
- 11955 Gloger St
- 11914 Gloger St
- 11921 Gloger St
- 11909 Gloger St
- 11906 Gloger St
- 11901 Gloger St
- 11858 Gloger St
- 11857 Gloger St
- 11849 Gloger St
- 11849 Gloger St
- 11926 Plum Meadow Ln
- 11922 Plum Meadow Ln
- 11930 Plum Meadow Ln
- 11934 Plum Meadow Ln
- 11918 Plum Meadow Ln
- 11914 Plum Meadow Ln