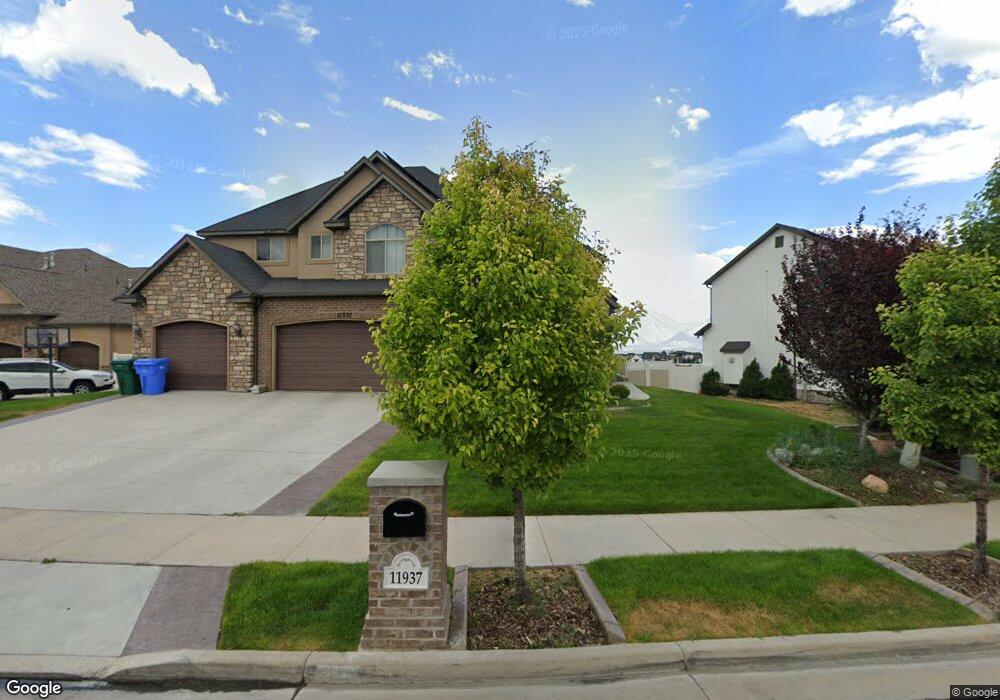
11937 Scenic Acres Dr Riverton, UT 84096
Estimated Value: $873,000 - $1,019,000
6
Beds
4
Baths
3,012
Sq Ft
$309/Sq Ft
Est. Value
About This Home
This home is located at 11937 Scenic Acres Dr, Riverton, UT 84096 and is currently estimated at $929,513, approximately $308 per square foot. 11937 Scenic Acres Dr is a home located in Salt Lake County with nearby schools including Midas Creek Elementary School, Oquirrh Hills Middle School, and Riverton High School.
Ownership History
Date
Name
Owned For
Owner Type
Purchase Details
Closed on
May 6, 2010
Sold by
Stewart Scott Robert
Bought by
Ferguson Paul and Ferguson Anika
Current Estimated Value
Home Financials for this Owner
Home Financials are based on the most recent Mortgage that was taken out on this home.
Original Mortgage
$365,083
Outstanding Balance
$250,030
Interest Rate
5.5%
Mortgage Type
FHA
Estimated Equity
$679,483
Purchase Details
Closed on
Nov 26, 2007
Sold by
Newline Construction Inc
Bought by
Stewart Scott Robert
Home Financials for this Owner
Home Financials are based on the most recent Mortgage that was taken out on this home.
Original Mortgage
$484,000
Interest Rate
9.62%
Mortgage Type
Purchase Money Mortgage
Purchase Details
Closed on
Dec 1, 2006
Sold by
Clark Melinda A
Bought by
Newline Construction Inc
Purchase Details
Closed on
Sep 28, 2006
Sold by
Newline Construction Inc
Bought by
Clark Melinda A
Create a Home Valuation Report for This Property
The Home Valuation Report is an in-depth analysis detailing your home's value as well as a comparison with similar homes in the area
Home Values in the Area
Average Home Value in this Area
Purchase History
| Date | Buyer | Sale Price | Title Company |
|---|---|---|---|
| Ferguson Paul | -- | Richland Title Ins Agency In | |
| Ferguson Paul | -- | Richland Title Ins Agency In | |
| Stewart Scott Robert | -- | Crown Title S Jordan | |
| Newline Construction Inc | -- | None Available | |
| Clark Melinda A | -- | Crown Title |
Source: Public Records
Mortgage History
| Date | Status | Borrower | Loan Amount |
|---|---|---|---|
| Open | Ferguson Paul | $365,083 | |
| Closed | Ferguson Paul | $365,083 | |
| Previous Owner | Stewart Scott Robert | $484,000 |
Source: Public Records
Tax History Compared to Growth
Tax History
| Year | Tax Paid | Tax Assessment Tax Assessment Total Assessment is a certain percentage of the fair market value that is determined by local assessors to be the total taxable value of land and additions on the property. | Land | Improvement |
|---|---|---|---|---|
| 2025 | $4,403 | $795,100 | $209,800 | $585,300 |
| 2024 | $4,403 | $762,000 | $200,200 | $561,800 |
| 2023 | $4,569 | $745,500 | $202,900 | $542,600 |
| 2022 | $4,764 | $762,500 | $198,900 | $563,600 |
| 2021 | $4,148 | $591,100 | $155,900 | $435,200 |
| 2020 | $4,097 | $544,400 | $155,900 | $388,500 |
| 2019 | $4,034 | $526,900 | $155,900 | $371,000 |
| 2018 | $3,937 | $506,400 | $135,500 | $370,900 |
| 2017 | $3,995 | $500,700 | $135,500 | $365,200 |
| 2016 | $3,898 | $468,800 | $126,600 | $342,200 |
| 2015 | $4,148 | $483,600 | $135,100 | $348,500 |
| 2014 | $3,692 | $422,000 | $119,400 | $302,600 |
Source: Public Records
Map
Nearby Homes
- 11777 S 4210 W
- 4347 W 11770 S
- 11851 S Graycliff Rd
- 4454 W 11800 S
- 4466 W 11800 S
- 12159 Swensen Cir
- 4463 W Harvest Sun Ln
- 4091 W Swensen Farm Dr
- 12667 S Lincoln Peak Ln Unit 132
- 12667 S Lincoln Peak Ln Unit 125
- 12667 S Lincoln Peak Ln
- 12671 S Lincoln Peak Ln Unit 131
- 12671 S Lincoln Peak Ln
- 12687 S Lincoln Peak Ln Unit 126
- 12687 S Lincoln Peak Ln
- 12693 S Lincoln Peak Ln
- 12668 S Lincoln Peak Ln Unit 109
- 12674 S Lincoln Peak Ln
- 12674 S Lincoln Peak Ln Unit 111
- 12676 S Lincoln Peak Ln
- 11937 Scenic Acres Dr Unit 217
- 11937 S Scenic Acres Dr
- 11943 Scenic Acres Dr
- 11923 Scenic Acres Dr
- 11923 S Scenic Acres Dr
- 11943 S Scenic Acres Dr
- 11942 Scenic Acres Dr
- 11916 Scenic Acres Dr
- 11907 Scenic Acres Dr
- 11907 S Scenic Acres Dr
- 11932 S Scenic Acres Dr
- 11932 S Scenic Acres Dr Unit 211
- 11932 S Scenic Acres Dr Unit 211
- 11952 S Scenic Acres Dr
- 11942 S Scenic Acres Dr
- 11958 S Scenic Acres Dr Unit 214
- 11958 S Scenic Acres Dr
- 11958 S Scenic Acres Dr Unit 215
- 11916 S Scenic Acres Dr
- 11916 S Scenic Acres Dr Unit 210