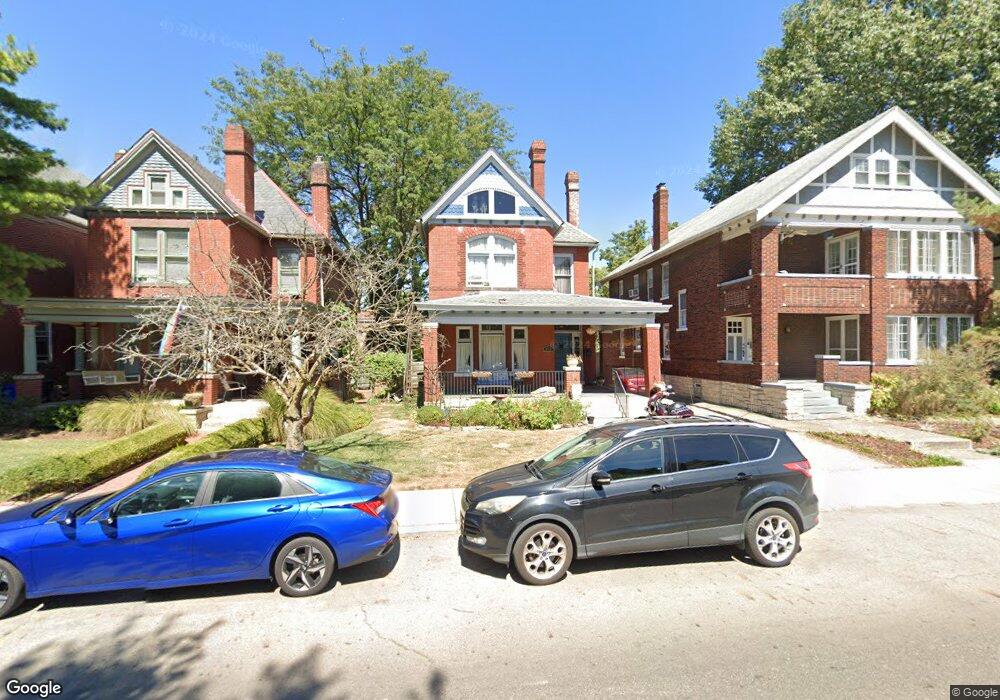
1194 Bryden Rd Columbus, OH 43205
Olde Towne East NeighborhoodEstimated Value: $436,658 - $587,000
3
Beds
2
Baths
3,000
Sq Ft
$175/Sq Ft
Est. Value
About This Home
This home is located at 1194 Bryden Rd, Columbus, OH 43205 and is currently estimated at $526,415, approximately $175 per square foot. 1194 Bryden Rd is a home located in Franklin County with nearby schools including Ohio Avenue Elementary School, Champion Middle School, and East High School.
Ownership History
Date
Name
Owned For
Owner Type
Purchase Details
Closed on
Sep 23, 2005
Sold by
Schulman Julia G and Riga Jeremy N
Bought by
Crow Tina M
Current Estimated Value
Home Financials for this Owner
Home Financials are based on the most recent Mortgage that was taken out on this home.
Original Mortgage
$260,930
Outstanding Balance
$140,299
Interest Rate
5.93%
Mortgage Type
Fannie Mae Freddie Mac
Estimated Equity
$386,116
Purchase Details
Closed on
May 31, 2005
Sold by
Harris Jeffrey Neal and Harris Julie N
Bought by
Schulman Julia G and Riga Jeremy N
Home Financials for this Owner
Home Financials are based on the most recent Mortgage that was taken out on this home.
Original Mortgage
$194,000
Interest Rate
5.75%
Mortgage Type
Purchase Money Mortgage
Purchase Details
Closed on
Sep 13, 2002
Sold by
Pentecostal Mission Deliverance Church and Paul A
Bought by
Harris Jeffrey Neal
Purchase Details
Closed on
Dec 3, 1979
Bought by
Pentecostal Mission
Create a Home Valuation Report for This Property
The Home Valuation Report is an in-depth analysis detailing your home's value as well as a comparison with similar homes in the area
Home Values in the Area
Average Home Value in this Area
Purchase History
| Date | Buyer | Sale Price | Title Company |
|---|---|---|---|
| Crow Tina M | $269,000 | -- | |
| Schulman Julia G | $242,500 | -- | |
| Harris Jeffrey Neal | $49,000 | -- | |
| Pentecostal Mission | -- | -- |
Source: Public Records
Mortgage History
| Date | Status | Borrower | Loan Amount |
|---|---|---|---|
| Open | Crow Tina M | $260,930 | |
| Previous Owner | Schulman Julia G | $194,000 |
Source: Public Records
Tax History Compared to Growth
Tax History
| Year | Tax Paid | Tax Assessment Tax Assessment Total Assessment is a certain percentage of the fair market value that is determined by local assessors to be the total taxable value of land and additions on the property. | Land | Improvement |
|---|---|---|---|---|
| 2024 | $5,381 | $119,600 | $41,720 | $77,880 |
| 2023 | $5,463 | $119,595 | $41,720 | $77,875 |
| 2022 | $4,022 | $74,210 | $6,760 | $67,450 |
| 2021 | $4,029 | $74,210 | $6,760 | $67,450 |
| 2020 | $4,034 | $74,210 | $6,760 | $67,450 |
| 2019 | $3,774 | $59,370 | $5,430 | $53,940 |
| 2018 | $4,254 | $59,370 | $5,430 | $53,940 |
| 2017 | $4,554 | $59,370 | $5,430 | $53,940 |
| 2016 | $5,437 | $81,070 | $5,290 | $75,780 |
| 2015 | $4,892 | $81,070 | $5,290 | $75,780 |
| 2014 | $4,904 | $81,070 | $5,290 | $75,780 |
| 2013 | $2,248 | $73,675 | $4,795 | $68,880 |
Source: Public Records
Map
Nearby Homes
- 1179 Franklin Ave
- 1217 Franklin Ave Unit 219
- 1117 Franklin Ave Unit 1119
- 1258 Oak St
- 140 Sherman Ave
- 187 S Ohio Ave
- 185 S Ohio Ave
- 233 S Ohio Ave Unit 11
- 1270 Franklin Ave
- 285 S Champion Ave Unit 287
- 1093 Franklin Ave
- 164 Wilson Ave
- 1084 Bryden Rd Unit 9
- 127 S Ohio Ave Unit 19
- 122 S Ohio Ave Unit 2
- 1174 E Rich St Unit 1172-1174
- 87-99 S Champion Ave
- 1029 Franklin Ave
- 138 Wilson Ave
- 1179 E Rich St
- 1188 Bryden Rd
- 1200 Bryden Rd Unit 202
- 1182 Bryden Rd Unit 184
- 1182-1184 Bryden Rd
- 1184 Bryden Rd
- 1182 Bryden Rd
- 235 Sherman Ave
- 1210 Bryden Rd Unit 208
- 1208 Bryden Rd
- 1176 Bryden Rd Unit 178
- 1216 Bryden Rd
- 1170 Bryden Rd Unit D
- 1170 Bryden Rd Unit B
- 1220 Bryden Rd
- 1185 Gustavus Ln Unit 5
- 1185 Gustavus Ln Unit D
- 1185 Gustavus Ln Unit F
- 1185 Gustavus Ln Unit E
- 1185 Gustavus Ln Unit C
- 1185 Gustavus Ln