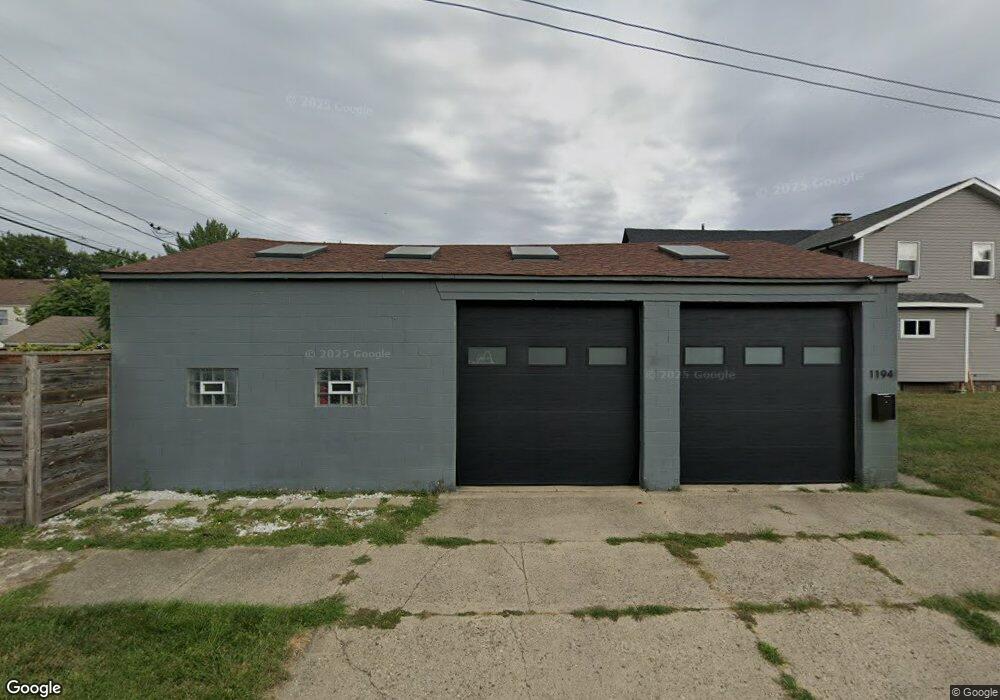
1194 W State St Columbus, OH 43222
Franklinton NeighborhoodEstimated Value: $243,632
2
Beds
1
Bath
1,176
Sq Ft
$207/Sq Ft
Est. Value
About This Home
This home is located at 1194 W State St, Columbus, OH 43222 and is currently estimated at $243,632, approximately $207 per square foot. 1194 W State St is a home located in Franklin County with nearby schools including Starling PK-8, West High School, and Central High School.
Ownership History
Date
Name
Owned For
Owner Type
Purchase Details
Closed on
Apr 12, 2023
Sold by
Laurel Investments Llc
Bought by
Jackson Glen
Current Estimated Value
Purchase Details
Closed on
Mar 23, 2023
Sold by
Laurel Investments Llc
Bought by
Jackson Glen
Purchase Details
Closed on
Apr 12, 2021
Sold by
Seven Hills Ventures Inc
Bought by
Laurel Investments Llc
Purchase Details
Closed on
Oct 26, 2020
Sold by
Marcum Kimberly
Bought by
Seven Hills Ventures Inc
Purchase Details
Closed on
Oct 16, 2020
Sold by
Marcum Kimberly
Bought by
Seven Hills Ventures Inc
Purchase Details
Closed on
Nov 12, 2019
Sold by
Ross Brian
Bought by
Marcum Kimberly
Purchase Details
Closed on
May 9, 2012
Sold by
Ross Dennie R and Ross Jacalyn S
Bought by
Ross Brian
Purchase Details
Closed on
Jan 19, 2000
Sold by
Cline Betty I
Bought by
Ross Dennis R and Ross Jacalyn S
Purchase Details
Closed on
Mar 1, 1999
Sold by
Cline Betty I
Bought by
Ross Rickey Dale
Home Financials for this Owner
Home Financials are based on the most recent Mortgage that was taken out on this home.
Original Mortgage
$25,000
Interest Rate
10%
Mortgage Type
Seller Take Back
Purchase Details
Closed on
May 16, 1979
Bought by
Cline Betty I
Create a Home Valuation Report for This Property
The Home Valuation Report is an in-depth analysis detailing your home's value as well as a comparison with similar homes in the area
Home Values in the Area
Average Home Value in this Area
Purchase History
| Date | Buyer | Sale Price | Title Company |
|---|---|---|---|
| Jackson Glen | $220,000 | Fidelity National Title | |
| Jackson Glen | $220,000 | Fidelity National Title | |
| Laurel Investments Llc | -- | Title Co Ltd | |
| Seven Hills Ventures Inc | $91,700 | Pm Title Llc | |
| Seven Hills Ventures Inc | $91,700 | Pm Title | |
| Marcum Kimberly | $63,000 | Pm Title Box | |
| Ross Brian | -- | None Available | |
| Ross Dennis R | $25,000 | -- | |
| Ross Rickey Dale | $30,000 | Amerititle Agency Inc | |
| Cline Betty I | -- | -- |
Source: Public Records
Mortgage History
| Date | Status | Borrower | Loan Amount |
|---|---|---|---|
| Previous Owner | Ross Rickey Dale | $25,000 |
Source: Public Records
Tax History Compared to Growth
Tax History
| Year | Tax Paid | Tax Assessment Tax Assessment Total Assessment is a certain percentage of the fair market value that is determined by local assessors to be the total taxable value of land and additions on the property. | Land | Improvement |
|---|---|---|---|---|
| 2024 | $3,110 | $41,900 | $8,230 | $33,670 |
| 2023 | $1,021 | $22,550 | $6,690 | $15,860 |
| 2022 | $958 | $18,030 | $1,160 | $16,870 |
| 2021 | $854 | $15,830 | $1,160 | $14,670 |
| 2020 | $678 | $12,710 | $1,160 | $11,550 |
| 2019 | $859 | $11,410 | $980 | $10,430 |
| 2018 | $996 | $11,410 | $980 | $10,430 |
| 2017 | $1,004 | $11,410 | $980 | $10,430 |
| 2016 | $1,091 | $12,470 | $1,510 | $10,960 |
| 2015 | $972 | $12,470 | $1,510 | $10,960 |
| 2014 | $773 | $12,470 | $1,510 | $10,960 |
| 2013 | $498 | $13,860 | $1,680 | $12,180 |
Source: Public Records
Map
Nearby Homes
- 49 S Yale Ave
- 37-39 S Yale Ave
- 116 W Park Ave
- 82 N Princeton Ave
- 33 S Princeton Ave
- 148 W Park Ave
- 87 S Princeton Ave
- 144 S Princeton Ave
- 79-81 Dana Ave
- 143 S Princeton Ave
- 112 S Cypress Ave
- 61 Dakota Ave
- 69-69.5 Chicago Ave
- 117 Dana Ave
- 119 Dana Ave
- 54-56 Brehl Ave
- 221 S Yale Ave
- 205 S Princeton Ave
- 55 Brehl Ave
- 146 Brehl Ave
- 91 S Yale Ave
- 87 S Yale Ave
- 87 N Yale Ave
- 83 S Yale Ave
- 79 S Yale Ave
- 101 S Yale Ave Unit 103
- 101-103 S Yale Ave
- 103 S Yale Ave
- 105 S Yale Ave
- 88 W Park Ave
- 113 S Yale Ave
- 84 W Park Ave
- 80 W Park Ave
- 117 S Yale Ave
- 92 W Park Ave
- 108-110 W Park Ave
- 117-119 S Yale Ave
- 76 W Park Ave
- 108 W Park Ave
- 121 S Yale Ave