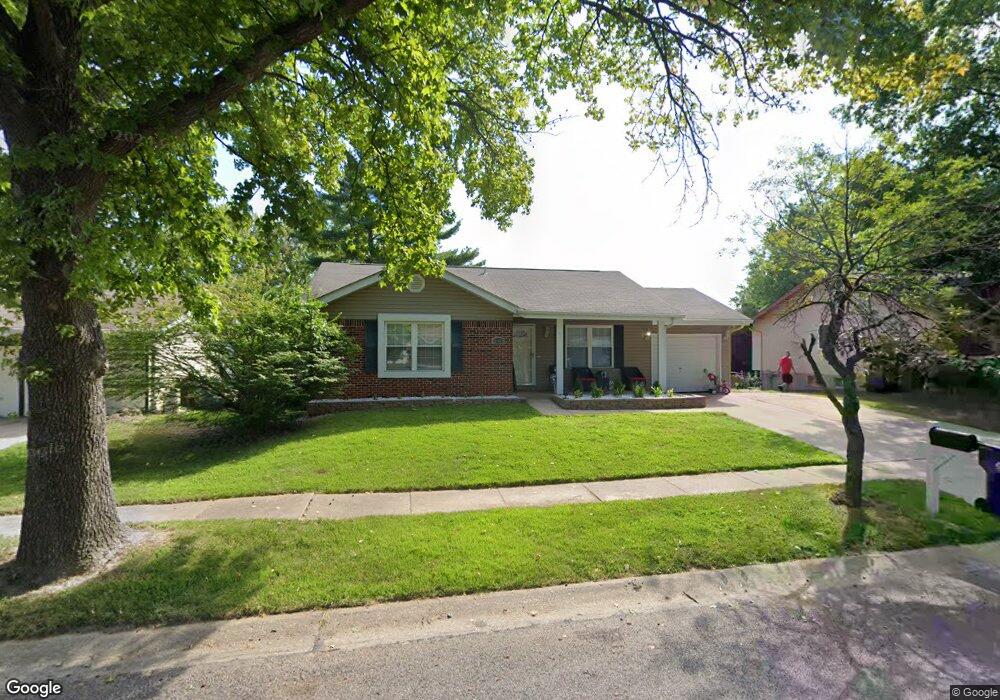
11944 Red Barn Ct Florissant, MO 63033
Estimated Value: $152,000 - $188,000
3
Beds
2
Baths
1,083
Sq Ft
$155/Sq Ft
Est. Value
About This Home
This home is located at 11944 Red Barn Ct, Florissant, MO 63033 and is currently estimated at $168,338, approximately $155 per square foot. 11944 Red Barn Ct is a home located in St. Louis County with nearby schools including Townsend Elementary School, Central Middle School, and Hazelwood Central High School.
Ownership History
Date
Name
Owned For
Owner Type
Purchase Details
Closed on
Jan 31, 2023
Sold by
Fisher Jennifer
Bought by
Fischer-Moore Jennifer
Current Estimated Value
Home Financials for this Owner
Home Financials are based on the most recent Mortgage that was taken out on this home.
Original Mortgage
$50,000
Outstanding Balance
$48,303
Interest Rate
6.27%
Mortgage Type
Credit Line Revolving
Estimated Equity
$120,035
Purchase Details
Closed on
Jan 17, 2023
Sold by
Moore Rico D
Bought by
Fisher-Moore Jennifer
Home Financials for this Owner
Home Financials are based on the most recent Mortgage that was taken out on this home.
Original Mortgage
$50,000
Outstanding Balance
$48,303
Interest Rate
6.27%
Mortgage Type
Credit Line Revolving
Estimated Equity
$120,035
Purchase Details
Closed on
Nov 13, 2012
Sold by
Allman Builders Llc
Bought by
Fisher Jennifer
Home Financials for this Owner
Home Financials are based on the most recent Mortgage that was taken out on this home.
Original Mortgage
$81,593
Interest Rate
3.37%
Mortgage Type
FHA
Purchase Details
Closed on
Sep 15, 2011
Sold by
Federal National Mortgage Association
Bought by
Allman Builders Llc
Home Financials for this Owner
Home Financials are based on the most recent Mortgage that was taken out on this home.
Original Mortgage
$67,500
Interest Rate
4.34%
Mortgage Type
Future Advance Clause Open End Mortgage
Purchase Details
Closed on
Mar 28, 2011
Sold by
Morgan Michael C and Morgan Camilia R
Bought by
Federal National Mortgage Association
Purchase Details
Closed on
Oct 12, 2006
Sold by
Morgan Michael C and Morgan Malva C
Bought by
Morgan Ii Michael C and Morgan Camilia
Home Financials for this Owner
Home Financials are based on the most recent Mortgage that was taken out on this home.
Original Mortgage
$135,000
Interest Rate
6.46%
Mortgage Type
Stand Alone Refi Refinance Of Original Loan
Purchase Details
Closed on
May 23, 2003
Sold by
Morgan Michael C
Bought by
Morgan Michael C and Morgan Malva C
Home Financials for this Owner
Home Financials are based on the most recent Mortgage that was taken out on this home.
Original Mortgage
$64,917
Interest Rate
5.65%
Mortgage Type
FHA
Purchase Details
Closed on
Feb 13, 2001
Sold by
Morgan Michael C and Morgan Malva C
Bought by
Morgan Michael C
Home Financials for this Owner
Home Financials are based on the most recent Mortgage that was taken out on this home.
Original Mortgage
$64,706
Interest Rate
7.1%
Mortgage Type
FHA
Create a Home Valuation Report for This Property
The Home Valuation Report is an in-depth analysis detailing your home's value as well as a comparison with similar homes in the area
Home Values in the Area
Average Home Value in this Area
Purchase History
| Date | Buyer | Sale Price | Title Company |
|---|---|---|---|
| Fischer-Moore Jennifer | -- | Chesterfield Title Agency | |
| Fisher-Moore Jennifer | -- | Chesterfield Title Agency | |
| Fisher Jennifer | $85,000 | Security Title Insurance Age | |
| Allman Builders Llc | $41,500 | Clear Title Group | |
| Federal National Mortgage Association | $115,444 | Mokan Title Services Llc | |
| Morgan Ii Michael C | -- | Kts | |
| Morgan Michael C | -- | -- | |
| Morgan Michael C | -- | -- |
Source: Public Records
Mortgage History
| Date | Status | Borrower | Loan Amount |
|---|---|---|---|
| Open | Fisher-Moore Jennifer | $50,000 | |
| Previous Owner | Fisher Jennifer | $81,593 | |
| Previous Owner | Allman Builders Llc | $67,500 | |
| Previous Owner | Morgan Ii Michael C | $135,000 | |
| Previous Owner | Morgan Michael C | $64,917 | |
| Previous Owner | Morgan Michael C | $64,706 |
Source: Public Records
Tax History Compared to Growth
Tax History
| Year | Tax Paid | Tax Assessment Tax Assessment Total Assessment is a certain percentage of the fair market value that is determined by local assessors to be the total taxable value of land and additions on the property. | Land | Improvement |
|---|---|---|---|---|
| 2025 | $2,207 | $27,230 | $3,570 | $23,660 |
| 2024 | $2,207 | $24,340 | $2,470 | $21,870 |
| 2023 | $2,207 | $24,340 | $2,470 | $21,870 |
| 2022 | $1,914 | $18,820 | $4,660 | $14,160 |
| 2021 | $1,812 | $18,820 | $4,660 | $14,160 |
| 2020 | $1,713 | $16,570 | $2,790 | $13,780 |
| 2019 | $1,700 | $16,570 | $2,790 | $13,780 |
| 2018 | $1,512 | $13,600 | $1,670 | $11,930 |
| 2017 | $1,510 | $13,600 | $1,670 | $11,930 |
| 2016 | $1,689 | $14,990 | $2,430 | $12,560 |
| 2015 | $1,650 | $14,990 | $2,430 | $12,560 |
| 2014 | $2,001 | $18,150 | $2,850 | $15,300 |
Source: Public Records
Map
Nearby Homes
- 11774 El Somo Ct
- 12065 El Camara Dr
- 6530 Farm Pond Ct
- 11760 Sheffield Dr
- 12095 El Camara Dr
- 12136 La Padera Ln
- 6250 Pennyrich Ct
- 11951 Jerries Ln
- 11757 Vizcuya Ct
- 12320 Missile Ln
- 11440 Sheffield Dr
- 2291 Redman Rd
- 11401 Northway Dr
- 12292 Jerries Ln
- 11377 Fox Hall Ln
- 5348 Trailoaks Dr
- 5432 Trailbend Dr
- 6480 Hadden Bay Dr
- 5372 Trailbend Dr
- 12455 Jerries Ln
- 11954 Red Barn Ct
- 11934 Red Barn Ct
- 11963 El Camara Dr
- 11973 El Camara Dr
- 11953 El Camara Dr
- 11924 Red Barn Ct
- 11964 Red Barn Ct
- 11945 Red Barn Ct
- 11935 Red Barn Ct
- 11983 El Camara Dr
- 11943 El Camara Dr
- 11953 Red Barn Ct
- 11974 Red Barn Ct
- 11914 Red Barn Ct
- 11955 Red Barn Ct
- 11925 Red Barn Ct
- 11933 El Camara Dr
- 11963 Red Barn Ct
- 11993 El Camara Dr
- 11960 El Camara Dr