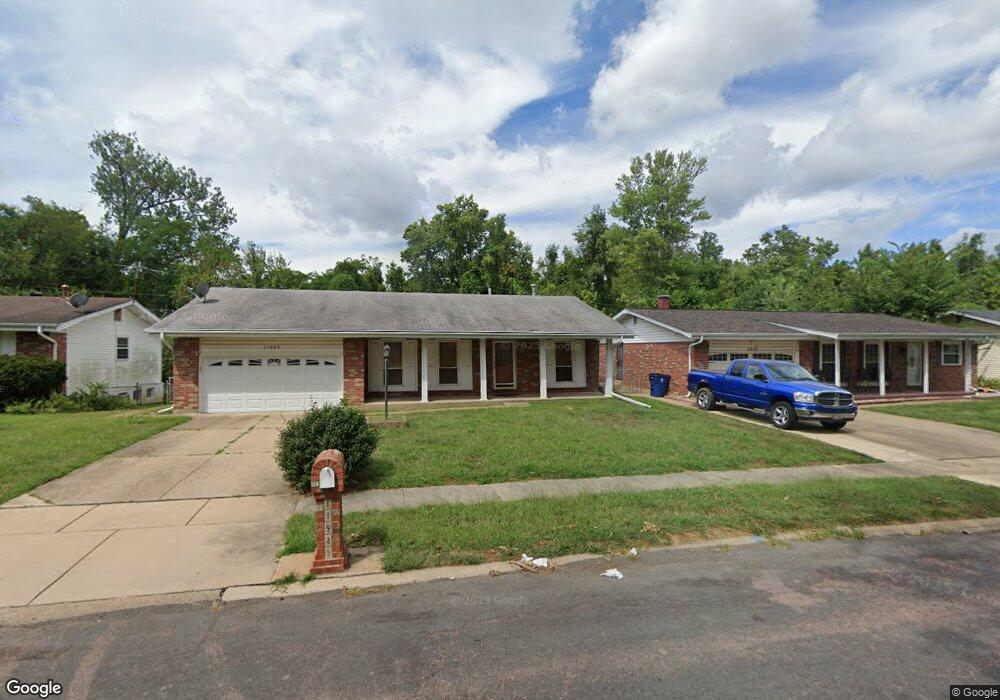
11945 Nero Dr Florissant, MO 63033
Estimated Value: $190,423 - $217,000
3
Beds
2
Baths
1,322
Sq Ft
$156/Sq Ft
Est. Value
About This Home
This home is located at 11945 Nero Dr, Florissant, MO 63033 and is currently estimated at $205,606, approximately $155 per square foot. 11945 Nero Dr is a home located in St. Louis County with nearby schools including Jury Elementary School, Central Middle School, and Hazelwood Central High School.
Ownership History
Date
Name
Owned For
Owner Type
Purchase Details
Closed on
Sep 11, 2012
Sold by
Gipson Jacqueline and Gibson Jacqueline
Bought by
Gipson Jacqueline
Current Estimated Value
Home Financials for this Owner
Home Financials are based on the most recent Mortgage that was taken out on this home.
Original Mortgage
$78,434
Outstanding Balance
$34,013
Interest Rate
3.59%
Mortgage Type
New Conventional
Estimated Equity
$171,593
Purchase Details
Closed on
Dec 24, 2002
Sold by
United Investment Properties Inc
Bought by
Gibson Jacqueline
Home Financials for this Owner
Home Financials are based on the most recent Mortgage that was taken out on this home.
Original Mortgage
$88,255
Interest Rate
6.06%
Purchase Details
Closed on
Nov 21, 2002
Sold by
Bowler Edith I and Schien Carol A
Bought by
United Investment Properties Inc
Home Financials for this Owner
Home Financials are based on the most recent Mortgage that was taken out on this home.
Original Mortgage
$88,255
Interest Rate
6.06%
Create a Home Valuation Report for This Property
The Home Valuation Report is an in-depth analysis detailing your home's value as well as a comparison with similar homes in the area
Home Values in the Area
Average Home Value in this Area
Purchase History
| Date | Buyer | Sale Price | Title Company |
|---|---|---|---|
| Gipson Jacqueline | -- | Orntic St Louis | |
| Gibson Jacqueline | $92,900 | -- | |
| United Investment Properties Inc | $72,000 | -- |
Source: Public Records
Mortgage History
| Date | Status | Borrower | Loan Amount |
|---|---|---|---|
| Open | Gipson Jacqueline | $78,434 | |
| Closed | Gibson Jacqueline | $88,255 | |
| Previous Owner | United Investment Properties Inc | $116,000 |
Source: Public Records
Tax History Compared to Growth
Tax History
| Year | Tax Paid | Tax Assessment Tax Assessment Total Assessment is a certain percentage of the fair market value that is determined by local assessors to be the total taxable value of land and additions on the property. | Land | Improvement |
|---|---|---|---|---|
| 2025 | $2,743 | $34,030 | $4,750 | $29,280 |
| 2024 | $2,743 | $30,110 | $3,170 | $26,940 |
| 2023 | $2,733 | $30,110 | $3,170 | $26,940 |
| 2022 | $2,339 | $22,880 | $5,550 | $17,330 |
| 2021 | $2,215 | $22,880 | $5,550 | $17,330 |
| 2020 | $2,188 | $21,050 | $3,650 | $17,400 |
| 2019 | $2,152 | $21,050 | $3,650 | $17,400 |
| 2018 | $2,160 | $19,540 | $2,530 | $17,010 |
| 2017 | $2,158 | $19,540 | $2,530 | $17,010 |
| 2016 | $2,079 | $18,510 | $2,850 | $15,660 |
| 2015 | $2,031 | $18,510 | $2,850 | $15,660 |
| 2014 | $1,997 | $18,110 | $2,830 | $15,280 |
Source: Public Records
Map
Nearby Homes
- 4354 Metarus Dr
- 11790 New Halls Ferry Rd
- 4327 Sulla Dr
- 4348 Vandals Dr
- 4384 Remus Dr
- 4493 Caracalla Dr
- 12062 Cato Dr
- 4401 Rhine Dr
- 3921 Max-Weich Place
- 3905 Max-Weich Place
- 11767 MacRinus Dr
- 11540 Lares Dr
- 4461 Rhine Dr
- 11636 MacRinus Dr
- 4471 Rhine Dr
- 11830 7 Hills Dr
- 4040 Helmkampf Dr
- 11565 Mehl Ave
- 4244 Miletus Dr
- 4497 Rhine Dr