
Seller's Agent in 2024
Bob Angilella
RE/MAX
(909) 556-9107
227 Total Sales


Estimated Value: $573,000 - $698,000
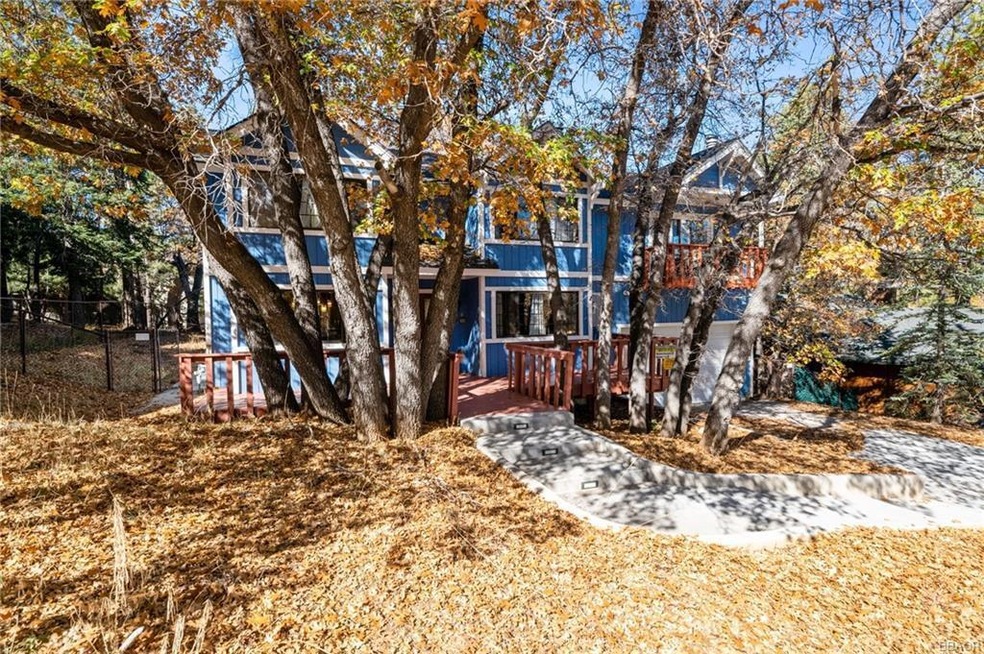
This welcoming Mountain Home features three oversized bedrooms and three bathrooms. Cozy winter nights await you as it boasts not one, but two inviting fireplaces. The open-concept living area, with its stone fireplace and natural light, invites you to relax and unwind. The large Kitchen has stainless steel appliances and there's an adjoining dining area for the whole gang. Additionally, the Master bedroom features its own cozy fireplace, creating a serene retreat for chilly evenings. Currently one of the other bedrooms is also used as a game room in addition to having bunk beds giving it a real 'kids retreat' feel. After a day on the slopes, step out onto the deck to unwind in the spa and soak in the Mountain views. Whether you're sipping hot cocoa or simply basking in the crisp mountain air, this deck provides the perfect sanctuary to appreciate the beauty of Upper Moonridge. Priced with the furnishings. Currently a Vacation Rental showing history of $24K - $40K in gross rents annually.
Last Agent to Sell the Property
RE/MAX Big Bear License #01228685 Listed on: 10/27/2023
We collect this data history from publicly available records. To have your information removed, we recommend requesting removal directly through your county’s website.
We collect this data history from publicly available records. To have your information removed, we recommend requesting removal directly through your county’s website.
| Date | Buyer | Sale Price | Title Company |
|---|---|---|---|
| $625,000 | Chicago Title | ||
| $400,000 | Chicago Title Inland Empire | ||
| -- | Fidelity National Title Co | ||
| $299,000 | Fidelity National Title Co | ||
| -- | Accommodation | ||
| $250,000 | -- | ||
| -- | -- | ||
| $162,500 | Commonwealth Land Title Co | ||
| $180,000 | Commonwealth Land Title Co |
We collect this data history from publicly available records. To have your information removed, we recommend requesting removal directly through your county’s website.
| Date | Status | Borrower | Loan Amount |
|---|---|---|---|
| Closed | $340,000 | ||
| Closed | $299,925 | ||
| Closed | $318,750 | ||
| Closed | $268,600 | ||
| Closed | $268,800 | ||
| Closed | $75,000 | ||
| Closed | $280,000 | ||
| Closed | $262,500 | ||
| Closed | $230,000 | ||
| Closed | $224,900 |
We collect this data history from publicly available records. To have your information removed, we recommend requesting removal directly through your county’s website.
| Date | Event | Price | List to Sale | Price per Sq Ft | Prior Sale |
|---|---|---|---|---|---|
| 02/12/2024 02/12/24 | Sold | $625,000 | -3.8% | $313 / Sq Ft | |
| 01/20/2024 01/20/24 | Pending | -- | -- | -- | |
| 12/03/2023 12/03/23 | For Sale | $649,900 | +4.0% | $325 / Sq Ft | |
| 12/01/2023 12/01/23 | Off Market | $625,000 | -- | -- | |
| 11/24/2023 11/24/23 | For Sale | $649,900 | +4.0% | $325 / Sq Ft | |
| 11/11/2023 11/11/23 | Off Market | $625,000 | -- | -- | |
| 11/06/2023 11/06/23 | Price Changed | $649,900 | -3.0% | $325 / Sq Ft | |
| 10/27/2023 10/27/23 | For Sale | $669,900 | +67.5% | $335 / Sq Ft | |
| 05/04/2018 05/04/18 | Sold | $399,900 | 0.0% | $200 / Sq Ft | View Prior Sale |
| 03/01/2018 03/01/18 | Sold | $399,900 | 0.0% | $200 / Sq Ft | View Prior Sale |
| 02/03/2018 02/03/18 | Pending | -- | -- | -- | |
| 01/29/2018 01/29/18 | Pending | -- | -- | -- | |
| 10/16/2017 10/16/17 | Price Changed | $399,900 | -5.9% | $200 / Sq Ft | |
| 09/06/2017 09/06/17 | For Sale | $425,000 | -9.6% | $213 / Sq Ft | |
| 02/17/2017 02/17/17 | For Sale | $469,900 | -- | $235 / Sq Ft |
We collect this data history from publicly available records. To have your information removed, we recommend requesting removal directly through your county’s website.
| Year | Tax Paid | Tax Assessment Tax Assessment Total Assessment is a certain percentage of the fair market value that is determined by local assessors to be the total taxable value of land and additions on the property. | Land | Improvement |
|---|---|---|---|---|
| 2025 | $7,881 | $625,000 | $125,000 | $500,000 |
| 2024 | $5,845 | $446,095 | $89,219 | $356,876 |
| 2023 | $5,715 | $437,348 | $87,470 | $349,878 |
| 2022 | $5,544 | $428,773 | $85,755 | $343,018 |
| 2021 | $5,443 | $420,366 | $84,074 | $336,292 |
| 2020 | $5,506 | $416,056 | $83,212 | $332,844 |
| 2019 | $5,367 | $407,898 | $81,580 | $326,318 |
| 2018 | $4,342 | $322,134 | $64,427 | $257,707 |
| 2017 | $4,233 | $315,818 | $63,164 | $252,654 |
| 2016 | $4,133 | $309,625 | $61,925 | $247,700 |
| 2015 | $4,082 | $304,974 | $60,995 | $243,979 |
| 2014 | $4,000 | $299,000 | $59,800 | $239,200 |
Seller's Agent in 2024
Bob Angilella
RE/MAX
(909) 556-9107
227 Total Sales
Buyer's Agent in 2024
Rob Jansen
Jansen Team Real Estate
(714) 914-4996
23 Total Sales
Source: California Desert Association of REALTORS®
MLS Number: 219102009
APN: 0310-861-01
Disclaimer: Certain information contained herein is derived from information provided by parties other than Homes.com. All information provided is deemed reliable, but is not guaranteed to be accurate and should be independently verified.
![]() IDX information is provided exclusively for personal, non-commercial use, and may not be used for any purpose other than to identify prospective properties consumers may be interested in purchasing. Information is deemed reliable but not guaranteed.
IDX information is provided exclusively for personal, non-commercial use, and may not be used for any purpose other than to identify prospective properties consumers may be interested in purchasing. Information is deemed reliable but not guaranteed.
Ask me questions while you tour the home.