1195 Hassell Rd Hoffman Estates, IL 60169
High Point Park NeighborhoodEstimated Value: $407,000 - $469,000
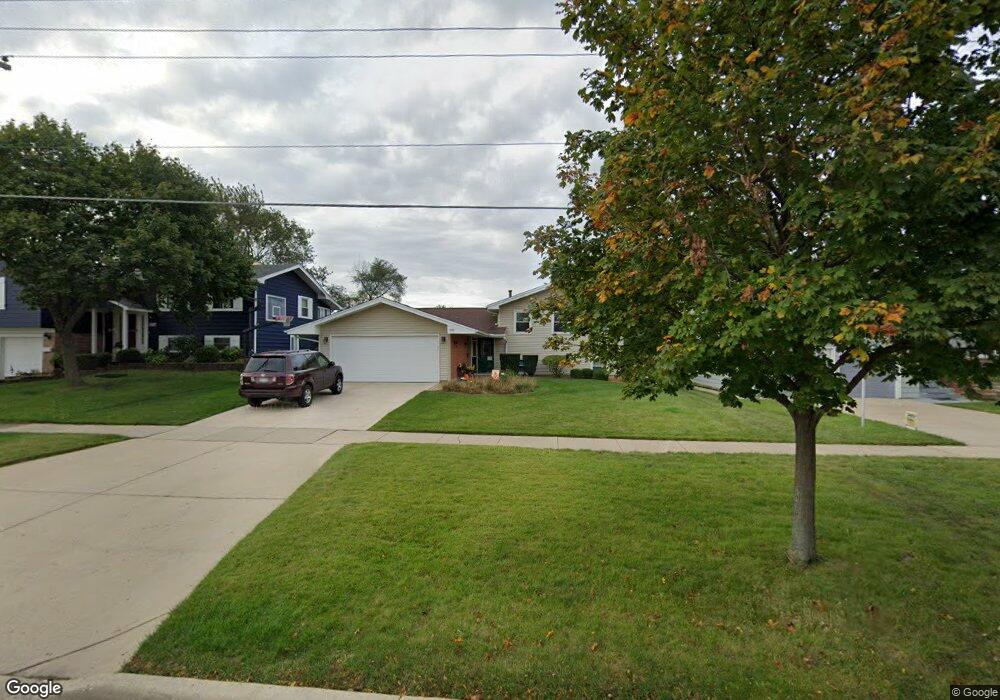
About This Home
This home is located at 1195 Hassell Rd, Hoffman Estates, IL 60169 and is currently estimated at $450,109, approximately $248 per square foot. 1195 Hassell Rd is a home located in Cook County with nearby schools including MacArthur International Spanish Academy, Dwight D Eisenhower Junior High School, and Hoffman Estates High School.
Ownership History
We collect this data history from publicly available records. To have your information removed, we recommend requesting removal directly through your county’s website.
Purchase Details
Purchase Details
Home Financials for this Owner
Home Financials are based on the most recent Mortgage that was taken out on this home.Purchase Details
Home Financials for this Owner
Home Financials are based on the most recent Mortgage that was taken out on this home.Home Values in the Area
Average Home Value in this Area
Purchase History
We collect this data history from publicly available records. To have your information removed, we recommend requesting removal directly through your county’s website.
| Date | Buyer | Sale Price | Title Company |
|---|---|---|---|
| -- | -- | ||
| $225,000 | -- | ||
| $95,000 | Chicago Title Insurance Co | ||
| $80,000 | Chicago Title Insurance Co |
Mortgage History
We collect this data history from publicly available records. To have your information removed, we recommend requesting removal directly through your county’s website.
| Date | Status | Borrower | Loan Amount |
|---|---|---|---|
| Open | $180,000 | ||
| Previous Owner | $85,500 |
Tax History
We collect this data history from publicly available records. To have your information removed, we recommend requesting removal directly through your county’s website.
| Year | Tax Paid | Tax Assessment Tax Assessment Total Assessment is a certain percentage of the fair market value that is determined by local assessors to be the total taxable value of land and additions on the property. | Land | Improvement |
|---|---|---|---|---|
| 2025 | $9,945 | $40,000 | $9,581 | $30,419 |
| 2024 | $9,945 | $35,722 | $7,985 | $27,737 |
| 2023 | $9,593 | $35,722 | $7,985 | $27,737 |
| 2022 | $9,593 | $35,722 | $7,985 | $27,737 |
| 2021 | $7,512 | $25,751 | $5,323 | $20,428 |
| 2020 | $7,411 | $25,751 | $5,323 | $20,428 |
| 2019 | $7,373 | $28,613 | $5,323 | $23,290 |
| 2018 | $7,237 | $25,629 | $4,524 | $21,105 |
| 2017 | $7,127 | $25,629 | $4,524 | $21,105 |
| 2016 | $6,892 | $25,629 | $4,524 | $21,105 |
| 2015 | $6,125 | $21,694 | $3,992 | $17,702 |
| 2014 | $6,034 | $21,694 | $3,992 | $17,702 |
| 2013 | $5,861 | $21,694 | $3,992 | $17,702 |
Map
- 1170 Lancaster Ct
- 1145 Nottingham Ln
- 1000 Lancaster Ct
- 1350 Nottingham Ln
- 1140 Rosedale Ln
- 1150 Glen Ln
- 1964 Kenilworth Cir Unit 1964
- 1360 Devonshire Ln
- 1975 Kenilworth Cir Unit B
- 1345 Devonshire Ln
- 1419 Churchill Rd
- 1756 Fayette Walk Unit C
- 1800 Huntington Blvd Unit 607
- 575 Jamison Ln
- 1726 Sessions Walk Unit 1726
- 1724 Fayette Walk Unit F
- 1840 Huntington Blvd Unit BW511
- 1840 Huntington Blvd Unit 607
- 1804 Fayette Walk Unit G
- 2021 Kensington Ln Unit 3004
- 1185 Hassell Rd
- 1205 Hassell Rd
- 1175 Hassell Rd
- 1150 Lancaster Ct
- 1215 Hassell Cir
- 1219 Hassell Cir
- 1140 Lancaster Ct
- 1160 Lancaster Ct
- 1225 Hassell Cir
- 1165 Hassell Rd
- 1130 Lancaster Ct
- 2005 Greenfield Rd
- 1229 Hassell Cir
- 2000 Hilltop Rd
- 1155 Hassell Rd
- 1120 Lancaster Ct
- 2015 Greenfield Rd
- 1220 Hassell Rd
- 2010 Hilltop Rd
- 1180 Lancaster Ct
Ask me questions while you tour the home.