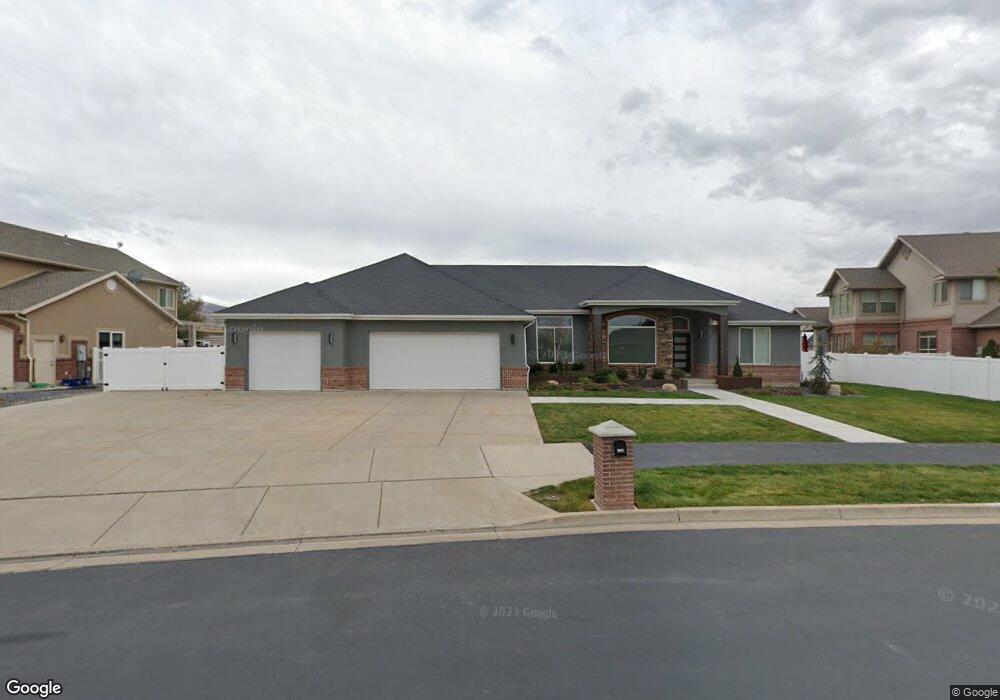
1195 Jessis Meadow Way West Bountiful, UT 84087
Estimated Value: $726,000 - $1,244,000
3
Beds
3
Baths
2,756
Sq Ft
$343/Sq Ft
Est. Value
About This Home
This home is located at 1195 Jessis Meadow Way, West Bountiful, UT 84087 and is currently estimated at $945,916, approximately $343 per square foot. 1195 Jessis Meadow Way is a home located in Davis County with nearby schools including West Bountiful Elementary School, Bountiful Junior High School, and Viewmont High School.
Ownership History
Date
Name
Owned For
Owner Type
Purchase Details
Closed on
Dec 6, 2021
Sold by
Ray Benjamin Lyle
Bought by
Ray Benjamin L and Ray Lori R
Current Estimated Value
Purchase Details
Closed on
Dec 14, 2018
Sold by
Nuttal William B and Nuttall Richard T
Bought by
Ray Benjamin Lyle
Purchase Details
Closed on
Jan 30, 2004
Sold by
Ferrell Douglas Scott and Ferrell Michelle
Bought by
Prince Development Llc
Purchase Details
Closed on
Sep 17, 2001
Sold by
Prince Development Llc
Bought by
Nuttall V Blaine and Nuttall Barbara
Create a Home Valuation Report for This Property
The Home Valuation Report is an in-depth analysis detailing your home's value as well as a comparison with similar homes in the area
Home Values in the Area
Average Home Value in this Area
Purchase History
| Date | Buyer | Sale Price | Title Company |
|---|---|---|---|
| Ray Benjamin L | -- | None Available | |
| Ray Benjamin Lyle | -- | Sutherland Title | |
| Prince Development Llc | -- | Bonneville Title Company Inc | |
| Nuttall V Blaine | -- | Guardian Title Company |
Source: Public Records
Tax History Compared to Growth
Tax History
| Year | Tax Paid | Tax Assessment Tax Assessment Total Assessment is a certain percentage of the fair market value that is determined by local assessors to be the total taxable value of land and additions on the property. | Land | Improvement |
|---|---|---|---|---|
| 2025 | $4,934 | $388,850 | $196,731 | $192,119 |
| 2024 | $4,483 | $357,500 | $163,671 | $193,829 |
| 2023 | $4,414 | $647,000 | $296,333 | $350,667 |
| 2022 | $4,936 | $383,900 | $152,830 | $231,070 |
| 2021 | $4,026 | $546,000 | $227,715 | $318,285 |
| 2020 | $3,890 | $479,000 | $194,230 | $284,770 |
| 2019 | $3,856 | $470,000 | $183,393 | $286,607 |
| 2018 | $3,346 | $439,000 | $166,076 | $272,924 |
| 2016 | $2,971 | $212,575 | $63,043 | $149,532 |
| 2015 | $3,217 | $196,130 | $63,043 | $133,087 |
| 2014 | $2,309 | $181,710 | $63,043 | $118,667 |
| 2013 | -- | $193,389 | $58,752 | $134,637 |
Source: Public Records
Map
Nearby Homes
- 280 N 1100 W
- Carson Plan at Amberly Place
- 2050 Farmhouse Plan at Amberly Place
- Pasadena Plan at Amberly Place
- Portland Plan at Amberly Place
- 1084 W Audrey Ln Unit 20
- 1084 W Audrey Ln
- 825 W 1320 N
- 767 W 220 N
- 988 W 1950 N Unit 134
- 637 W 1600 N
- 680 W 500 S Unit 22
- 680 W 500 S Unit 17
- 1075 W Audrey Ln Unit 6
- Swiss 2 - Urban Plan at The Audrey - theAUDREY
- Swiss 3 - Urban Plan at The Audrey - theAUDREY
- Swiss 1 - Cottage Plan at The Audrey - theAUDREY
- Swiss 4 - Cottage Plan at The Audrey - theAUDREY
- Swiss 2 - Cottage Plan at The Audrey - theAUDREY
- Swiss 3 - Cottage Plan at The Audrey - theAUDREY
- 1205 Jessis Meadow Way
- 1185 Jessis Meadow Way
- 1215 Jessis Meadow Way
- 1200 Jessis Meadow Cir
- 1175 Jessis Meadow Way
- 1210 Jessis Meadow Way
- 1190 Jessis Meadow Way
- 1222 Jessis Meadow Cir
- 1225 Jessis Meadow Way
- 1180 Jessis Meadow Way Unit 22
- 746 Jessis Meadow Dr
- 831 N 1100 W
- 1220 Jessis Meadow Way
- 756 Jessis Meadow Dr
- 1197 Jessis Meadow Cir
- 1173 Jessis Meadow Cir
- 1217 Jessis Meadow Cir
- 1255 Jessis Meadow Way
- 725 Jessis Meadow Dr
- 650 Jessis Meadow Dr