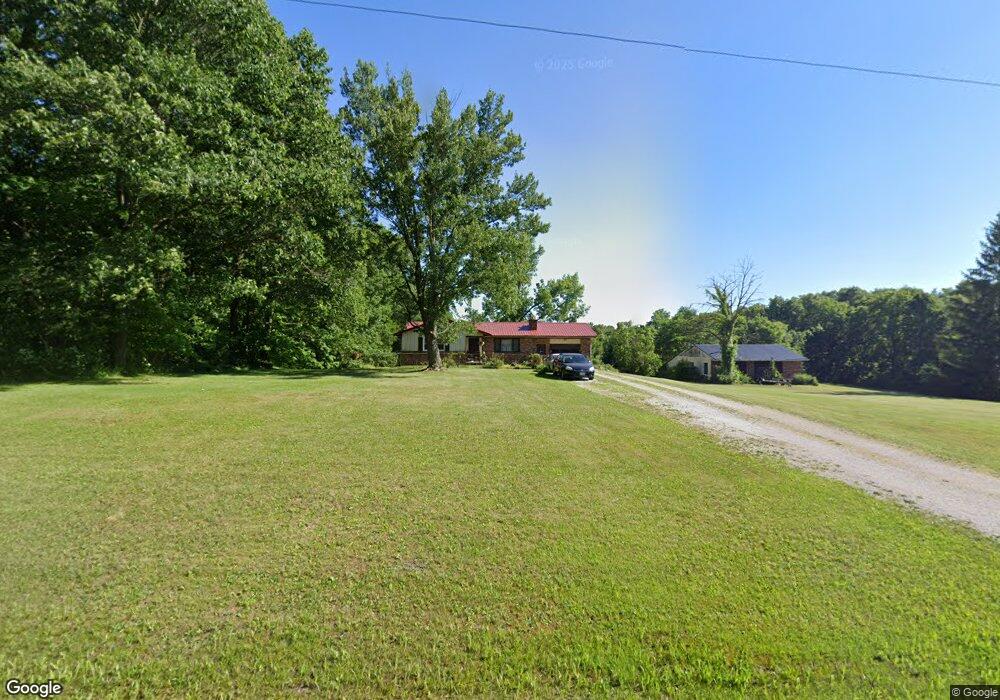
1195 Kaster Rd Shiloh, OH 44878
Estimated Value: $161,000 - $225,315
3
Beds
2
Baths
1,224
Sq Ft
$158/Sq Ft
Est. Value
About This Home
This home is located at 1195 Kaster Rd, Shiloh, OH 44878 and is currently estimated at $193,329, approximately $157 per square foot. 1195 Kaster Rd is a home located in Richland County with nearby schools including Shiloh Elementary School, Shiloh Middle School, and Plymouth High School.
Ownership History
Date
Name
Owned For
Owner Type
Purchase Details
Closed on
Sep 1, 1989
Current Estimated Value
Create a Home Valuation Report for This Property
The Home Valuation Report is an in-depth analysis detailing your home's value as well as a comparison with similar homes in the area
Purchase History
| Date | Buyer | Sale Price | Title Company |
|---|---|---|---|
| -- | $54,000 | -- |
Source: Public Records
Tax History
| Year | Tax Paid | Tax Assessment Tax Assessment Total Assessment is a certain percentage of the fair market value that is determined by local assessors to be the total taxable value of land and additions on the property. | Land | Improvement |
|---|---|---|---|---|
| 2024 | $1,792 | $49,730 | $15,460 | $34,270 |
| 2023 | $1,831 | $49,730 | $15,460 | $34,270 |
| 2022 | $1,767 | $41,670 | $14,430 | $27,240 |
| 2021 | $1,776 | $41,670 | $14,430 | $27,240 |
| 2020 | $1,864 | $41,670 | $14,430 | $27,240 |
| 2019 | $1,631 | $35,540 | $12,230 | $23,310 |
| 2018 | $1,622 | $35,540 | $12,230 | $23,310 |
| 2017 | $1,594 | $35,540 | $12,230 | $23,310 |
| 2016 | $1,572 | $36,680 | $11,810 | $24,870 |
| 2015 | $1,572 | $36,680 | $11,810 | $24,870 |
| 2014 | $1,595 | $36,680 | $11,810 | $24,870 |
| 2012 | $757 | $36,680 | $11,810 | $24,870 |
Source: Public Records
Map
Nearby Homes
- 6225 Rome South Rd
- 412 Lattimer Rd W
- 27 High St
- 13 Mechanics St
- 49 North St
- 4197 Ganges-Five Points Rd
- 2392 E Smiley Rd
- 1121 Clayberg Rd Unit 75
- 1121 Clayberg Rd Unit 81
- 1121 Clayberg Rd Unit 21
- 1121 Clayberg Rd Unit 39
- 1121 Clayberg Rd Unit 53
- 1121 Clayberg Rd Unit 26
- 2484 E Smiley Rd
- 1211 Clayberg Rd Unit 51
- 4253 NE North Main St
- 6247 State Route 61 N
- 1845 Taylortown Rd
- 185 Broadway St
- 228 E Main St
- 1200 Kaster Rd
- 1309 Kaster Rd
- 1145 Kaster Rd
- 1325 Kaster Rd
- 0 Ohio 603
- 1119 State Route 603 W
- 1220 Lamp Rd
- 1395 Kaster Rd
- 1395 Kaster Rd
- 960 State Route 603 W
- 953 State Route 603 W
- 1298 Lamp Rd
- 1540 Kaster Rd
- 1542 Kaster Rd
- 1263 State Route 603 W
- 1230 Lamp Rd
- 1134 State Route 603 W
- 924 Lattimer Rd W
- 1428 Lamp Rd
- 1205 State Route 603 W
Your Personal Tour Guide
Ask me questions while you tour the home.