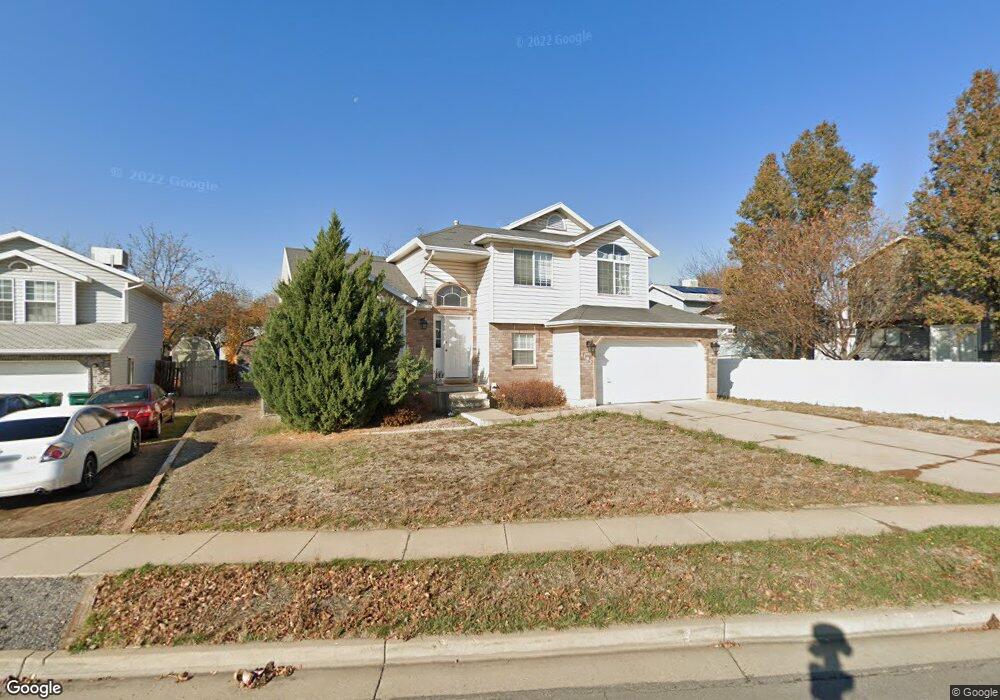
1195 N 100 W Layton, UT 84041
Estimated Value: $494,000 - $517,000
4
Beds
4
Baths
2,126
Sq Ft
$237/Sq Ft
Est. Value
About This Home
This home is located at 1195 N 100 W, Layton, UT 84041 and is currently estimated at $503,142, approximately $236 per square foot. 1195 N 100 W is a home located in Davis County with nearby schools including Crestview Elementary School, Central Davis Junior High School, and Northridge High School.
Ownership History
Date
Name
Owned For
Owner Type
Purchase Details
Closed on
Jul 30, 2019
Sold by
Arnr Holdings Llc
Bought by
Patil Dinesh and Rao Poorvi
Current Estimated Value
Home Financials for this Owner
Home Financials are based on the most recent Mortgage that was taken out on this home.
Original Mortgage
$240,000
Outstanding Balance
$210,175
Interest Rate
3.8%
Mortgage Type
New Conventional
Estimated Equity
$292,967
Purchase Details
Closed on
May 28, 2019
Sold by
Property Seller Solutions Llc
Bought by
Arnr Holdings Llc
Purchase Details
Closed on
May 16, 2019
Sold by
Cole Timothy A and Cole Wendee S
Bought by
Property Seller Solutions Llc
Purchase Details
Closed on
Oct 28, 1996
Sold by
Lambros Wendy K
Bought by
Cole Timothy A and Cole Wendee S
Home Financials for this Owner
Home Financials are based on the most recent Mortgage that was taken out on this home.
Original Mortgage
$134,985
Interest Rate
8.3%
Mortgage Type
FHA
Create a Home Valuation Report for This Property
The Home Valuation Report is an in-depth analysis detailing your home's value as well as a comparison with similar homes in the area
Home Values in the Area
Average Home Value in this Area
Purchase History
| Date | Buyer | Sale Price | Title Company |
|---|---|---|---|
| Patil Dinesh | -- | Title Guarantee | |
| Arnr Holdings Llc | -- | Richland Title | |
| Property Seller Solutions Llc | -- | Richland Title Ins Agency | |
| Cole Timothy A | -- | Security Title Co |
Source: Public Records
Mortgage History
| Date | Status | Borrower | Loan Amount |
|---|---|---|---|
| Open | Patil Dinesh | $240,000 | |
| Previous Owner | Cole Timothy A | $134,985 |
Source: Public Records
Tax History Compared to Growth
Tax History
| Year | Tax Paid | Tax Assessment Tax Assessment Total Assessment is a certain percentage of the fair market value that is determined by local assessors to be the total taxable value of land and additions on the property. | Land | Improvement |
|---|---|---|---|---|
| 2025 | $2,395 | $251,350 | $103,254 | $148,096 |
| 2024 | $2,408 | $254,650 | $120,237 | $134,413 |
| 2023 | $2,393 | $446,000 | $142,251 | $303,749 |
| 2022 | $2,511 | $254,100 | $75,418 | $178,682 |
| 2021 | $2,299 | $347,000 | $106,338 | $240,662 |
| 2020 | $2,092 | $303,000 | $89,245 | $213,755 |
| 2019 | $1,798 | $255,000 | $84,552 | $170,448 |
| 2018 | $1,622 | $231,000 | $84,552 | $146,448 |
| 2016 | $1,506 | $110,605 | $27,162 | $83,443 |
| 2015 | $1,428 | $99,605 | $27,162 | $72,443 |
| 2014 | $1,446 | $103,131 | $27,162 | $75,969 |
| 2013 | -- | $98,590 | $26,884 | $71,706 |
Source: Public Records
Map
Nearby Homes