Estimated Value: $364,504 - $418,000
3
Beds
3
Baths
1,872
Sq Ft
$207/Sq Ft
Est. Value
About This Home
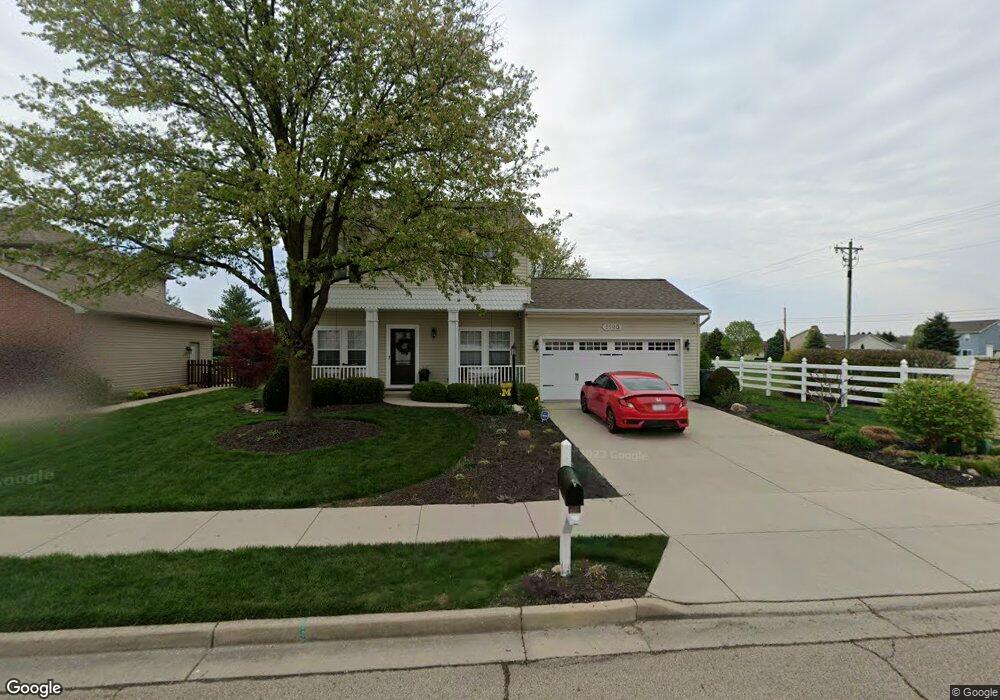
This home is located at 1195 Parkview Dr, Troy, OH 45373 and is currently estimated at $387,126, approximately $206 per square foot. 1195 Parkview Dr is a home located in Miami County with nearby schools including Concord Elementary School, Van Cleve Elementary School, and Troy Junior High School.
Ownership History
Date
Name
Owned For
Owner Type
Purchase Details
Closed on
Apr 17, 2014
Sold by
Galli Anthony Vincent and Galli Kimberly Renee
Bought by
Kindell Monte L and Kindell Emily J
Current Estimated Value
Home Financials for this Owner
Home Financials are based on the most recent Mortgage that was taken out on this home.
Original Mortgage
$170,000
Outstanding Balance
$129,572
Interest Rate
4.41%
Mortgage Type
New Conventional
Estimated Equity
$257,554
Purchase Details
Closed on
Aug 6, 2010
Sold by
Krall Michael F and Krall Linda K
Bought by
Donnan Kimberly R
Home Financials for this Owner
Home Financials are based on the most recent Mortgage that was taken out on this home.
Original Mortgage
$144,800
Interest Rate
4.58%
Mortgage Type
New Conventional
Purchase Details
Closed on
Feb 16, 2006
Sold by
Oberer Residential Const
Bought by
Krall Michael F and Krall Linda K
Home Financials for this Owner
Home Financials are based on the most recent Mortgage that was taken out on this home.
Original Mortgage
$100,000
Interest Rate
6.3%
Mortgage Type
New Conventional
Create a Home Valuation Report for This Property
The Home Valuation Report is an in-depth analysis detailing your home's value as well as a comparison with similar homes in the area
Home Values in the Area
Average Home Value in this Area
Purchase History
| Date | Buyer | Sale Price | Title Company |
|---|---|---|---|
| Kindell Monte L | $179,000 | Attorney | |
| Donnan Kimberly R | $181,000 | -- | |
| Krall Michael F | $170,000 | -- |
Source: Public Records
Mortgage History
| Date | Status | Borrower | Loan Amount |
|---|---|---|---|
| Open | Kindell Monte L | $170,000 | |
| Closed | Krall Michael F | $144,800 | |
| Previous Owner | Krall Michael F | $100,000 |
Source: Public Records
Tax History
| Year | Tax Paid | Tax Assessment Tax Assessment Total Assessment is a certain percentage of the fair market value that is determined by local assessors to be the total taxable value of land and additions on the property. | Land | Improvement |
|---|---|---|---|---|
| 2024 | $4,125 | $96,290 | $19,600 | $76,690 |
| 2023 | $3,632 | $96,290 | $19,600 | $76,690 |
| 2022 | $3,025 | $96,290 | $19,600 | $76,690 |
| 2021 | $2,654 | $80,260 | $16,350 | $63,910 |
| 2020 | $2,658 | $80,260 | $16,350 | $63,910 |
| 2019 | $2,683 | $80,260 | $16,350 | $63,910 |
| 2018 | $2,519 | $72,520 | $16,380 | $56,140 |
| 2017 | $2,315 | $65,980 | $16,380 | $49,600 |
| 2016 | $2,280 | $65,980 | $16,380 | $49,600 |
| 2015 | $2,125 | $58,910 | $14,630 | $44,280 |
| 2014 | $2,125 | $58,910 | $14,630 | $44,280 |
| 2013 | $2,138 | $58,910 | $14,630 | $44,280 |
Source: Public Records
Map
Nearby Homes
- 2880 Manor Ct
- 2778 Southside Dr
- 1181 Winchester Dr
- 2927 Huntington Dr
- 2924 Huntington Dr
- 1369 Goldenrod Dr
- 1345 Kenton Way
- 2972 Huntington Dr
- 1432 Goldenrod Dr
- 1464 Goldenrod Dr
- 1470 Goldenrod Dr
- 2904 Hoying Dr
- 2928 Hoying Dr
- 2944 Hoying Dr
- 2385 Worthington Dr
- 2863 Netherfield Cir
- 612 Barnhart Rd
- 1811 Greenbriar Dr
- 606 Barnhart Rd
- 00 W
- 1189 Parkview Dr
- 1187 Parkview Dr
- 2800 Manor Ct
- 1181 Parkview Dr
- 2830 Manor Ct
- 2789 Southside Dr
- 2777 Southside Dr
- 2801 Manor Ct
- 2763 Southside Dr
- 2811 Southside Dr
- 2749 Southside Dr
- 1173 Parkview Dr
- 2835 Manor Ct
- 2735 Southside Dr
- 2860 Manor Ct
- 2815 Southside Dr
- 1198 Pond View Dr
- 1171 Parkview Dr
- 2829 Southside Dr
- 1190 Pond View Dr
Your Personal Tour Guide
Ask me questions while you tour the home.